Dynamic Neural RSI Trend-Following Trading Strategy

Overview
This strategy is a quantitative trading system based on moving averages, RSI indicator, and trailing stop loss. It combines trend following and momentum indicators from technical analysis, achieving risk-controlled trading through strict entry and exit conditions. The core logic is to seek oversold opportunities in uptrends and protect profits using trailing stops.
Strategy Principles
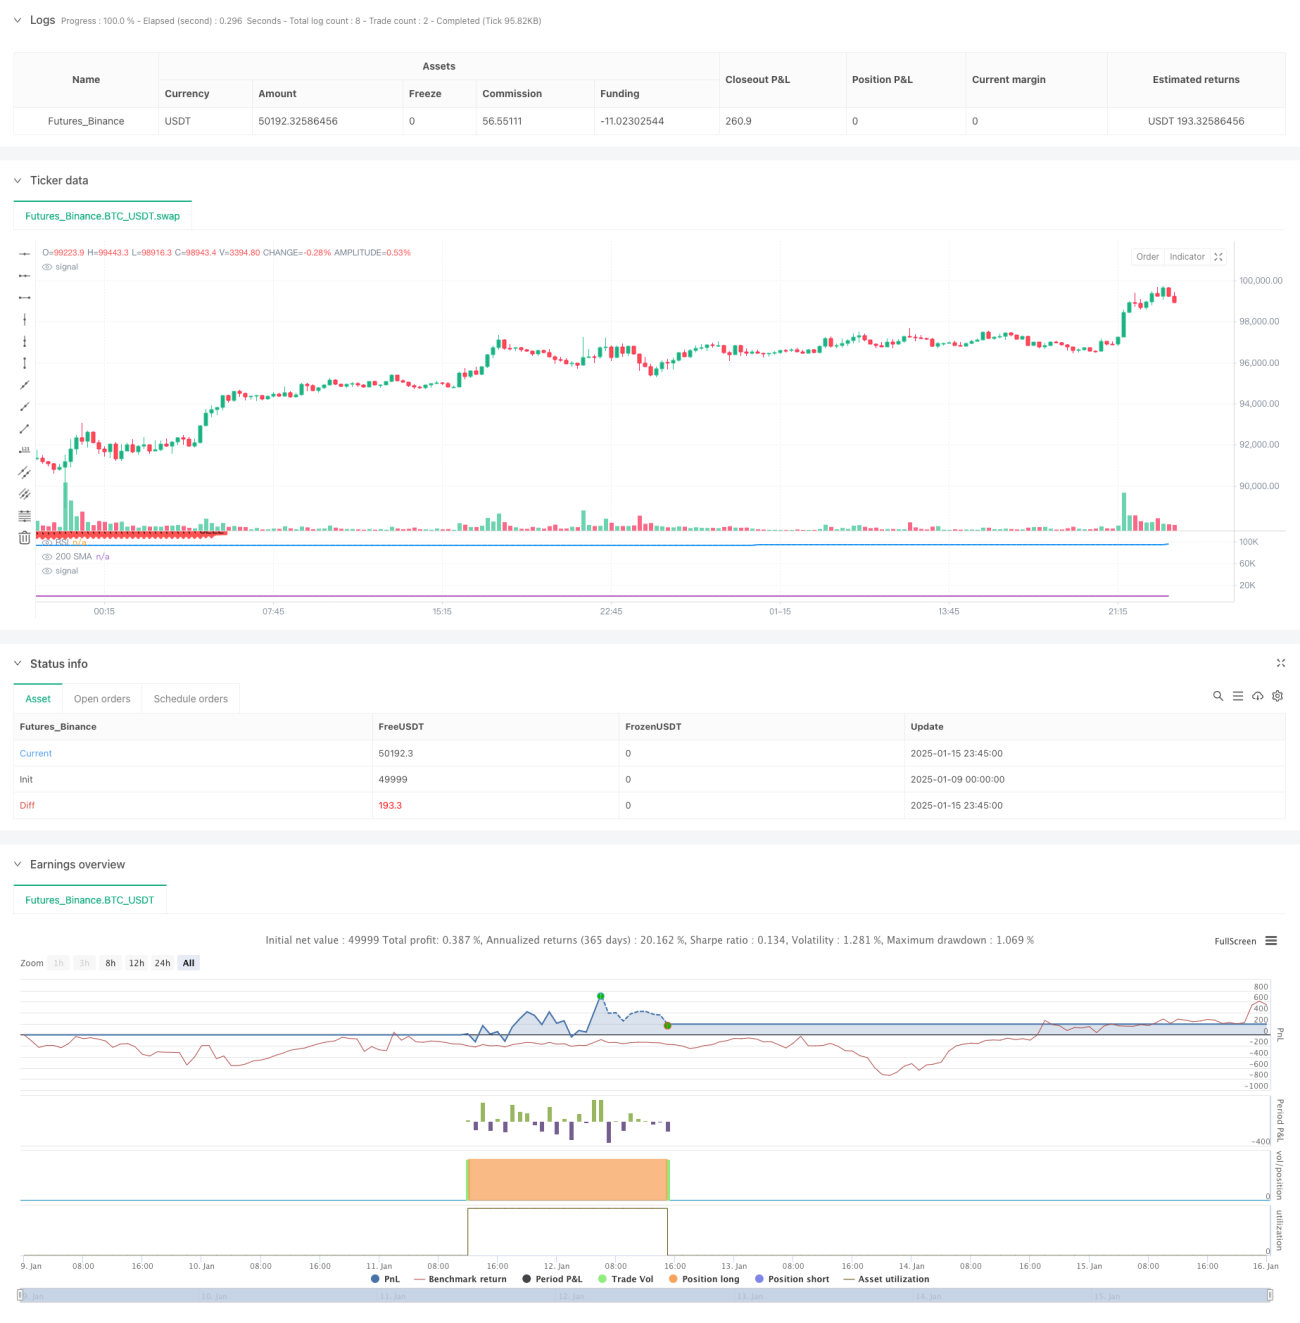
The strategy uses a 200-day Simple Moving Average (SMA) as the baseline for trend judgment, combined with the Relative Strength Index (RSI) for generating trading signals. Specifically:
- Uses 200-day SMA to judge the major trend, only considering long positions when price is above the average
- Identifies oversold signals when RSI falls below preset threshold (default 40)
- Triggers long entry when both conditions are met and waiting period since last exit (default 10 days) has elapsed
- Protects profits during position holding through trailing stop loss (default 5%)
- Exits position when price breaks below trailing stop or 200-day SMA
Strategy Advantages
- Combines trend and momentum double filtering to improve trading accuracy
- Uses trailing stop mechanism to effectively lock in profits
- Sets trading intervals to avoid frequent trading
- Strong parameter adjustability to adapt to different market environments
- Clear trading logic, easy to understand and execute
- Simple calculations with high computational efficiency
Strategy Risks
- Moving average lag may cause delayed entry and exit signals
- RSI indicator may generate false signals in ranging markets
- Fixed percentage trailing stop may not suit all market environments
- Parameter optimization may lead to overfitting
- May suffer significant drawdowns in highly volatile markets
Strategy Optimization Directions
- Introduce volatility-adaptive trailing stop percentage
- Add volume indicators as auxiliary confirmation
- Replace simple moving average with exponential moving average for better sensitivity
- Incorporate market sentiment indicators to optimize trading timing
- Develop dynamic parameter optimization mechanism
- Add multi-timeframe strategy confirmation mechanism
Summary
This is a quantitative trading strategy with complete structure and clear logic. It pursues stable returns while controlling risk by combining multiple technical indicators. Although there is room for optimization, the basic framework has good practicality and extensibility. The strategy is suitable for medium to long-term investors and adapts well to different market environments.
- 1