概述
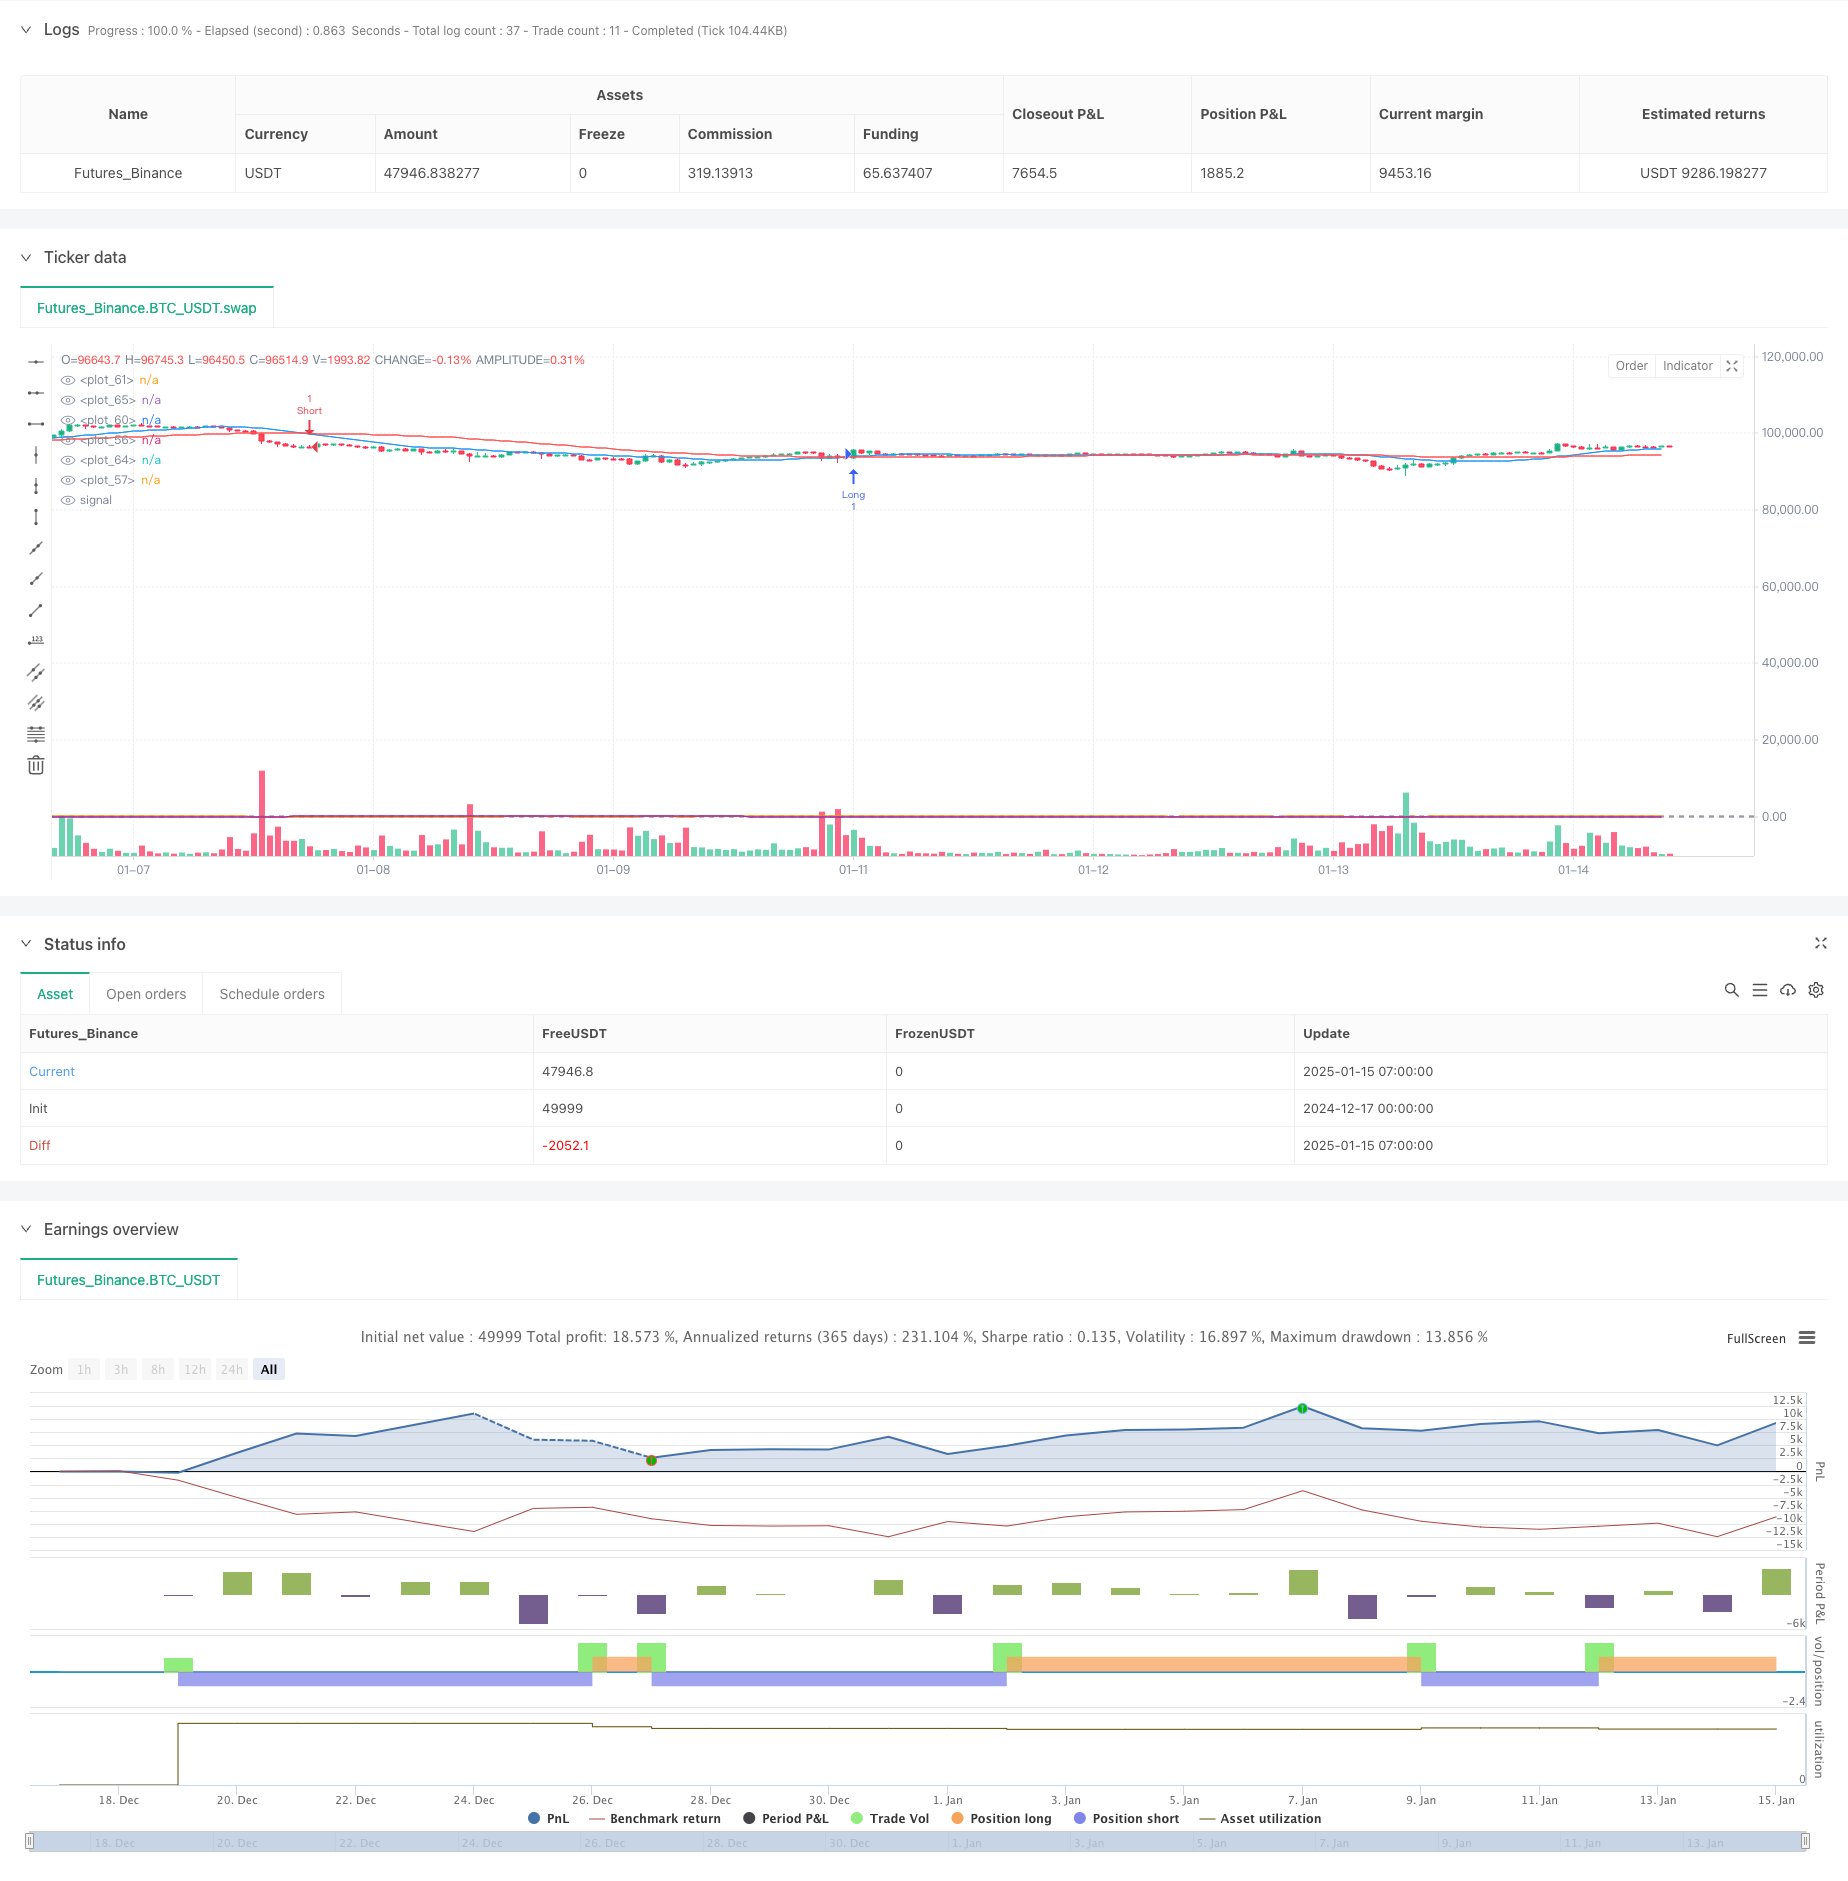
该策略是一个结合了多个技术指标的综合交易系统,主要利用移动平均线(MA)、相对强弱指标(RSI)和平均趋向指数(ADX)三个指标来识别市场趋势和动量,并通过真实波幅指标(ATR)来动态设置止损和止盈位置。系统采用多周期分析方法,通过不同时间周期的指标交叉来确认交易信号,既保证了交易的准确性,又能有效控制风险。
策略原理
策略采用三层验证机制来确认交易信号: 1. 趋势识别层:使用20周期和50周期两条移动平均线的交叉来判断趋势方向,快线上穿慢线视为上升趋势,反之为下降趋势。 2. 动量确认层:使用14周期RSI指标来确认价格动量,RSI大于50表示上升动量,小于50表示下降动量。 3. 趋势强度过滤层:使用14周期ADX指标来衡量趋势强度,只有ADX大于25时才确认趋势足够强劲可以交易。
同时,策略使用基于ATR的动态止损止盈系统: - 止损设置为2倍ATR - 止盈设置为4倍ATR,保持1:2的风险收益比
策略优势
- 多重确认机制:通过三个不同维度的技术指标互相验证,大大降低了虚假信号的影响。
- 动态风险管理:基于ATR的动态止损止盈设置,能够根据市场波动性自适应调整,避免固定点位带来的不合理风险。
- 趋势跟踪性强:通过MA系统识别趋势,并用ADX确认趋势强度,能够有效捕捉大趋势行情。
- 操作规范清晰:入场、止损、止盈等关键点位都有明确的量化标准,降低了主观判断带来的干扰。
策略风险
- 震荡市场风险:在横盘震荡市场中,均线频繁交叉可能导致虚假信号增多。
- 滞后性风险:技术指标都具有一定滞后性,可能在剧烈波动时错过最佳入场点。
- 参数敏感性:策略效果对参数设置较为敏感,不同市场环境可能需要调整参数。
- 系统性风险:在市场突发性重大事件影响下,技术指标可能失效。
策略优化方向
- 引入成交量指标:可以考虑增加成交量指标来辅助验证趋势的有效性。
- 优化参数自适应:可以开发自适应参数系统,根据不同的市场环境动态调整指标参数。
- 增加市场情绪指标:引入VIX等市场情绪指标,在高波动期间调整仓位或暂停交易。
- 完善止损机制:可以考虑增加追踪止损功能,更好地锁定利润。
总结
该策略通过多重技术指标的协同作用,构建了一个相对完整的交易系统。策略的核心优势在于其多层验证机制和动态风险管理系统,但也需要注意在不同市场环境下的适应性问题。通过持续优化和完善,该策略有望在实际交易中取得稳定的收益。
策略源码
/*backtest
start: 2024-12-17 00:00:00
end: 2025-01-15 08:00:00
period: 1h
basePeriod: 1h
exchanges: [{"eid":"Futures_Binance","currency":"BTC_USDT","balance":49999}]
*/

//@version=6
strategy("Daily Trading Strategy", overlay=true)

// --- Indikator ---
// Kombinasi MA untuk trend
fastMA = ta.sma(close, 20)
slowMA = ta.sma(close, 50)

// RSI untuk momentum
rsi = ta.rsi(close, 14)

// --- Fungsi untuk menghitung ADX ---
adx(length) =>
    up = ta.change(high)
    down = -ta.change(low)
    plusDM = na(up) ? na : (up > down and up > 0 ? up : 0)
    minusDM = na(down) ? na : (down > up and down > 0 ? down : 0)
    trur = ta.rma(ta.tr, length)
    plus = fixnan(100 * ta.rma(plusDM, length) / trur)
    minus = fixnan(100 * ta.rma(minusDM, length) / trur)
    sum = plus + minus
    adx = 100 * ta.rma(math.abs(plus - minus) / (sum == 0 ? 1 : sum), length)

// ADX untuk kekuatan trend
adxValue = adx(14)

// --- Kondisi Entry Long ---
longEntry = ta.crossover(fastMA, slowMA) and rsi > 50 and adxValue > 25

// --- Kondisi Entry Short ---
shortEntry = ta.crossunder(fastMA, slowMA) and rsi < 50 and adxValue > 25

// --- Stop Loss dan Take Profit ---
// Fungsi untuk menghitung stop loss dan take profit
getSLTP(entryPrice, isLong) =>
    atr = ta.atr(14)
    sl = isLong ? entryPrice - atr * 2 : entryPrice + atr * 2
    tp = isLong ? entryPrice + atr * 4 : entryPrice - atr * 4
    [sl, tp]

// Hitung SL dan TP untuk posisi Long
[longSL, longTP] = getSLTP(close, true)

// Hitung SL dan TP untuk posisi Short
[shortSL, shortTP] = getSLTP(close, false)

// --- Eksekusi Order ---
if (longEntry)
    strategy.entry("Long", strategy.long, stop=longSL, limit=longTP)

if (shortEntry)
    strategy.entry("Short", strategy.short, stop=shortSL, limit=shortTP)

// --- Plot Indikator ---
// MA
plot(fastMA, color=color.blue)
plot(slowMA, color=color.red)

// RSI
plot(rsi, color=color.orange)
hline(50, color=color.gray)

// ADX
plot(adxValue, color=color.purple)
hline(25, color=color.gray)

// --- Alert ---
alertcondition(longEntry, title="Long Entry", message="Long Entry")
alertcondition(shortEntry, title="Short Entry", message="Short Entry")
相关推荐