概述
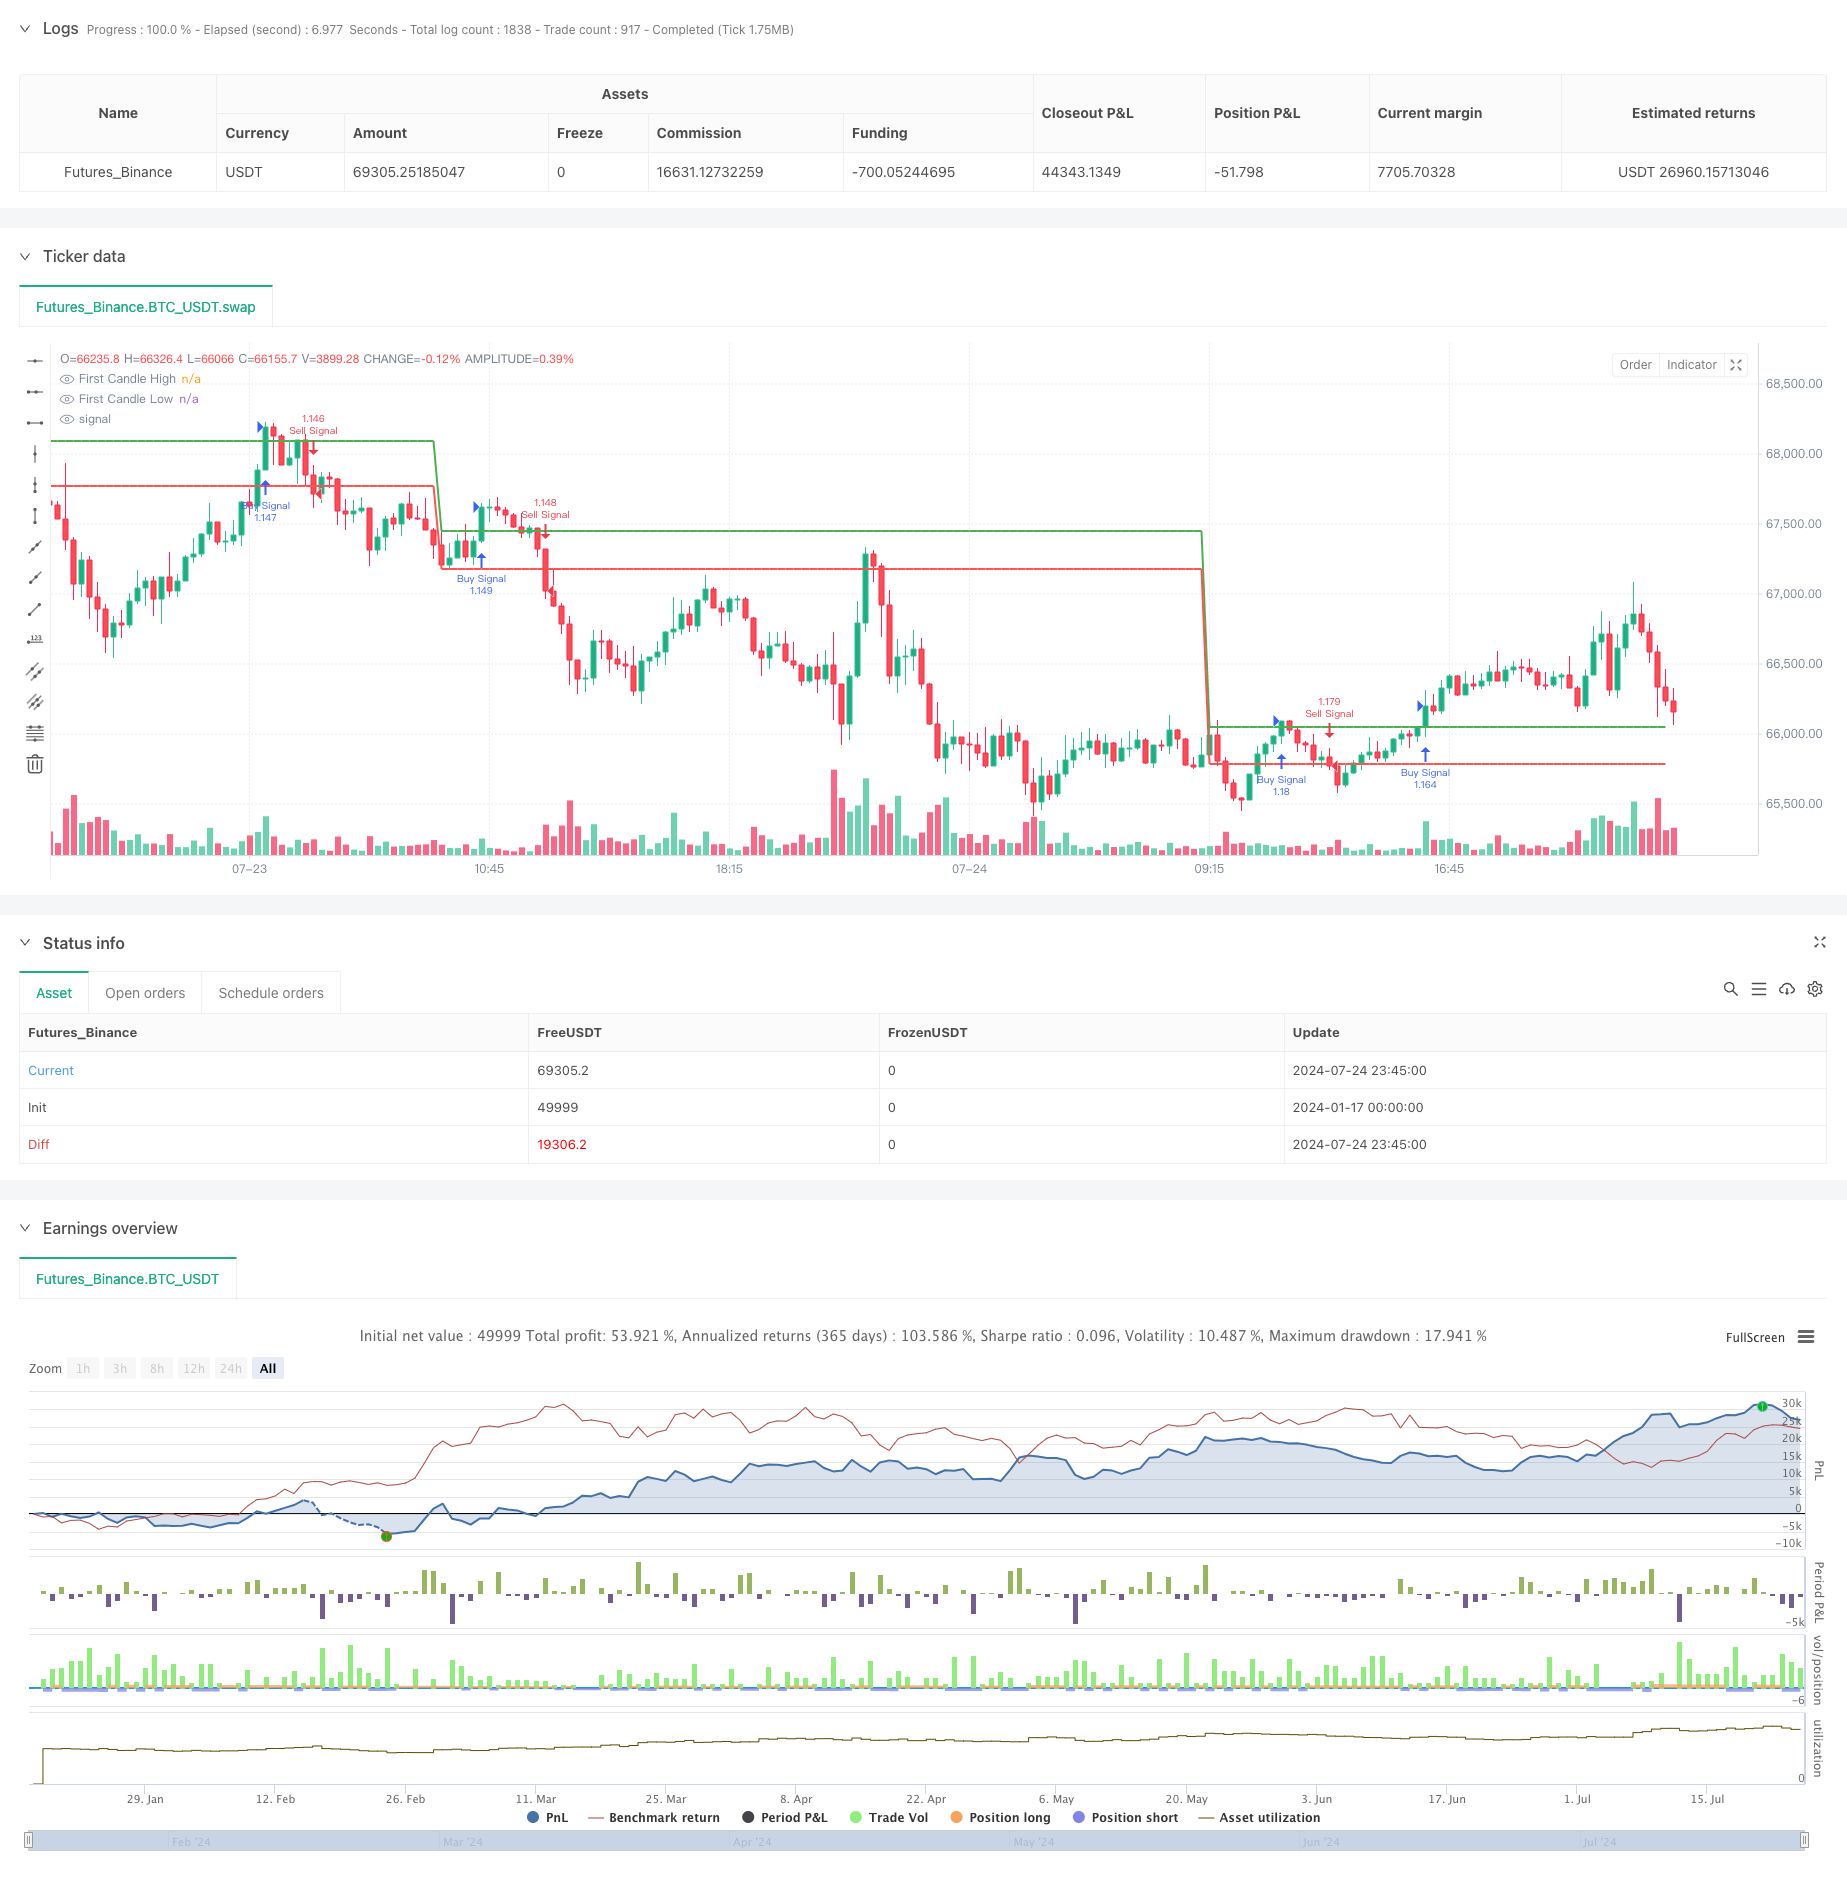
该策略是一个基于15分钟K线图的突破交易系统,核心思想是利用每个交易日第一根15分钟K线的高点和低点来构建价格通道,通过价格突破该通道来捕捉市场趋势。策略通过对开盘初期价格波动区间的分析,为日内交易提供明确的进场信号。
策略原理
策略的运作基于以下核心原理: 1. 时间窗口锁定 - 策略专注于捕捉9:15分时段的第一根K线,这个时间段通常包含了重要的价格信息。 2. 价格通道构建 - 利用第一根K线的最高价和最低价分别设置为上下轨道,形成交易通道。 3. 突破信号生成 - 当价格收盘突破通道上轨时产生做多信号,突破下轨时产生做空信号。 4. 自动化执行 - 通过程序化编码实现全自动交易,避免人为情绪干扰。
策略优势
- 简单直观 - 策略逻辑清晰,易于理解和执行,适合各层次的交易者。
- 时效性强 - 针对开盘时段的高波动特性,能够快速捕捉市场方向。
- 风险可控 - 通过明确的价格通道界定,为止损止盈提供客观参考。
- 适应性好 - 策略可应用于多种交易品种,具有良好的普适性。
- 自动化程度高 - 完整的程序化实现确保了交易的客观性和执行效率。
策略风险
- 假突破风险 - 市场可能出现虚假突破,导致错误信号。
- 波动率依赖 - 在低波动率环境下,策略表现可能不够理想。
- 时间局限性 - 仅适用于特定时间段,可能错过其他时间的机会。
- 滑点影响 - 在高度波动市场中可能面临较大滑点。
- 技术依赖 - 需要稳定的技术环境确保准确执行。
策略优化方向
- 引入波动率过滤 - 添加ATR指标来过滤低波动环境下的信号。
- 优化进场时机 - 结合成交量指标验证突破的有效性。
- 增加趋势确认 - 加入移动平均线等趋势指标提高信号质量。
- 动态止损优化 - 根据市场波动性调整止损位置。
- 改进时间窗口 - 研究不同时间窗口的表现,优化交易时段。
总结
该策略通过对开盘时段价格突破的监测,提供了一种简单但有效的交易方法。其核心优势在于逻辑简单、执行明确,但也需要交易者注意假突破风险和市场环境的适应性。通过持续优化和风险管理的改进,策略有望在实战中取得更好的表现。策略的成功应用需要交易者深入理解市场特性,并结合自身风险承受能力做出合理调整。
策略源码
/*backtest
start: 2024-01-17 00:00:00
end: 2024-07-25 00:00:00
period: 15m
basePeriod: 15m
exchanges: [{"eid":"Futures_Binance","currency":"BTC_USDT","balance":49999}]
*/

// This Pine Script™ code is subject to the terms of the Mozilla Public License 2.0 at https://mozilla.org/MPL/2.0/
// © OLYANGO
//@version=5
strategy("15 Min Breakout Strategy by https://x.com/iamgod43 (Yallappa) ", overlay=true, default_qty_type=strategy.percent_of_equity, default_qty_value=100)

// Define the start of backtest period
startDate = timestamp(2023, 1, 1, 0, 0)

// Ensure the script is run on a 15-minute chart
// if (timeframe.period != "15")
//     alert("Switch to a 15-minute chart for this strategy.", alert.freq_once_per_bar_close)

// Variables to store the first 15-minute candle's high and low
var float firstCandleHigh = na
var float firstCandleLow = na
var bool isFirstCandleCaptured = false

// Detect the first candle of the session
isFirstCandle = (hour == 9 and minute == 15)

// Reset first candle values for the new session
if isFirstCandle
    firstCandleHigh := high
    firstCandleLow := low
    isFirstCandleCaptured := true

// Check for breakout conditions
longCondition = isFirstCandleCaptured and close > firstCandleHigh
shortCondition = isFirstCandleCaptured and close < firstCandleLow

// Entry signals
if longCondition
    strategy.entry("Buy Signal", strategy.long)

if shortCondition
    strategy.entry("Sell Signal", strategy.short)

// Plot the first 15-minute candle high and low
plot(isFirstCandleCaptured ? firstCandleHigh : na, color=color.green, linewidth=2, title="First Candle High")
plot(isFirstCandleCaptured ? firstCandleLow : na, color=color.red, linewidth=2, title="First Candle Low")

// Backtesting start date logic
if time < startDate
    strategy.close_all("Pre-Backtest Period")
相关推荐