
Overview
This strategy combines trend following with a time-based exit mechanism. The core concept is to capture market trends by monitoring price relationships with the 60-day moving average while incorporating a year-end forced liquidation mechanism for risk control. Long positions are entered when the closing price breaks above the 60-day MA with a positive slope, and all positions are closed on the last trading day of each year.
Strategy Principles
The strategy is based on several core elements:
- Trend Determination: Uses a 60-day Simple Moving Average (SMA) as a medium-term trend indicator, with a 14-day slope calculation to confirm trend direction.
- Entry Signal: Buy signals are generated when price breaks above the 60-day MA with a positive slope, indicating a potential uptrend.
- Exit Mechanism: Implements a fixed time-based exit, closing all positions on the last trading day of each year to avoid cross-year position risks.
- Trading Time Management: Incorporates date range control and trading day validation to ensure operations only occur on valid trading days.
Strategy Advantages
- Strong Trend Following: Effectively captures medium to long-term trends through the moving average system.
- Robust Risk Control: Year-end forced liquidation effectively manages position risk and eliminates cross-year uncertainties.
- Clear Operating Rules: Entry and exit conditions are well-defined, facilitating execution and backtesting.
- High Adaptability: Strategy parameters can be adjusted to accommodate different market characteristics.
Strategy Risks
- MA Lag: Moving averages have inherent lag, potentially causing delayed entry timing.
- Poor Performance in Ranging Markets: May generate frequent false breakout signals in sideways markets.
- Fixed Exit Risk: Year-end forced liquidation might lead to premature exit from good trends.
- Parameter Sensitivity: Strategy performance is sensitive to MA period and other parameter settings.
Optimization Directions
- Additional Trend Confirmation: Consider incorporating RSI, MACD for improved trend validation.
- Enhanced Exit Mechanism: Add stop-loss and take-profit conditions rather than relying solely on time-based exits.
- Dynamic Parameter Adjustment: Implement dynamic MA period adjustment based on market volatility.
- Position Management: Introduce ATR-based position sizing for improved capital efficiency.
Summary
This strategy creates a relatively robust trading system by combining trend following with time management. Its simple and clear logic makes it easy to understand and implement, offering good practical utility. With appropriate parameter optimization and supplementary risk control measures, the strategy shows potential for generating stable returns in real trading conditions.
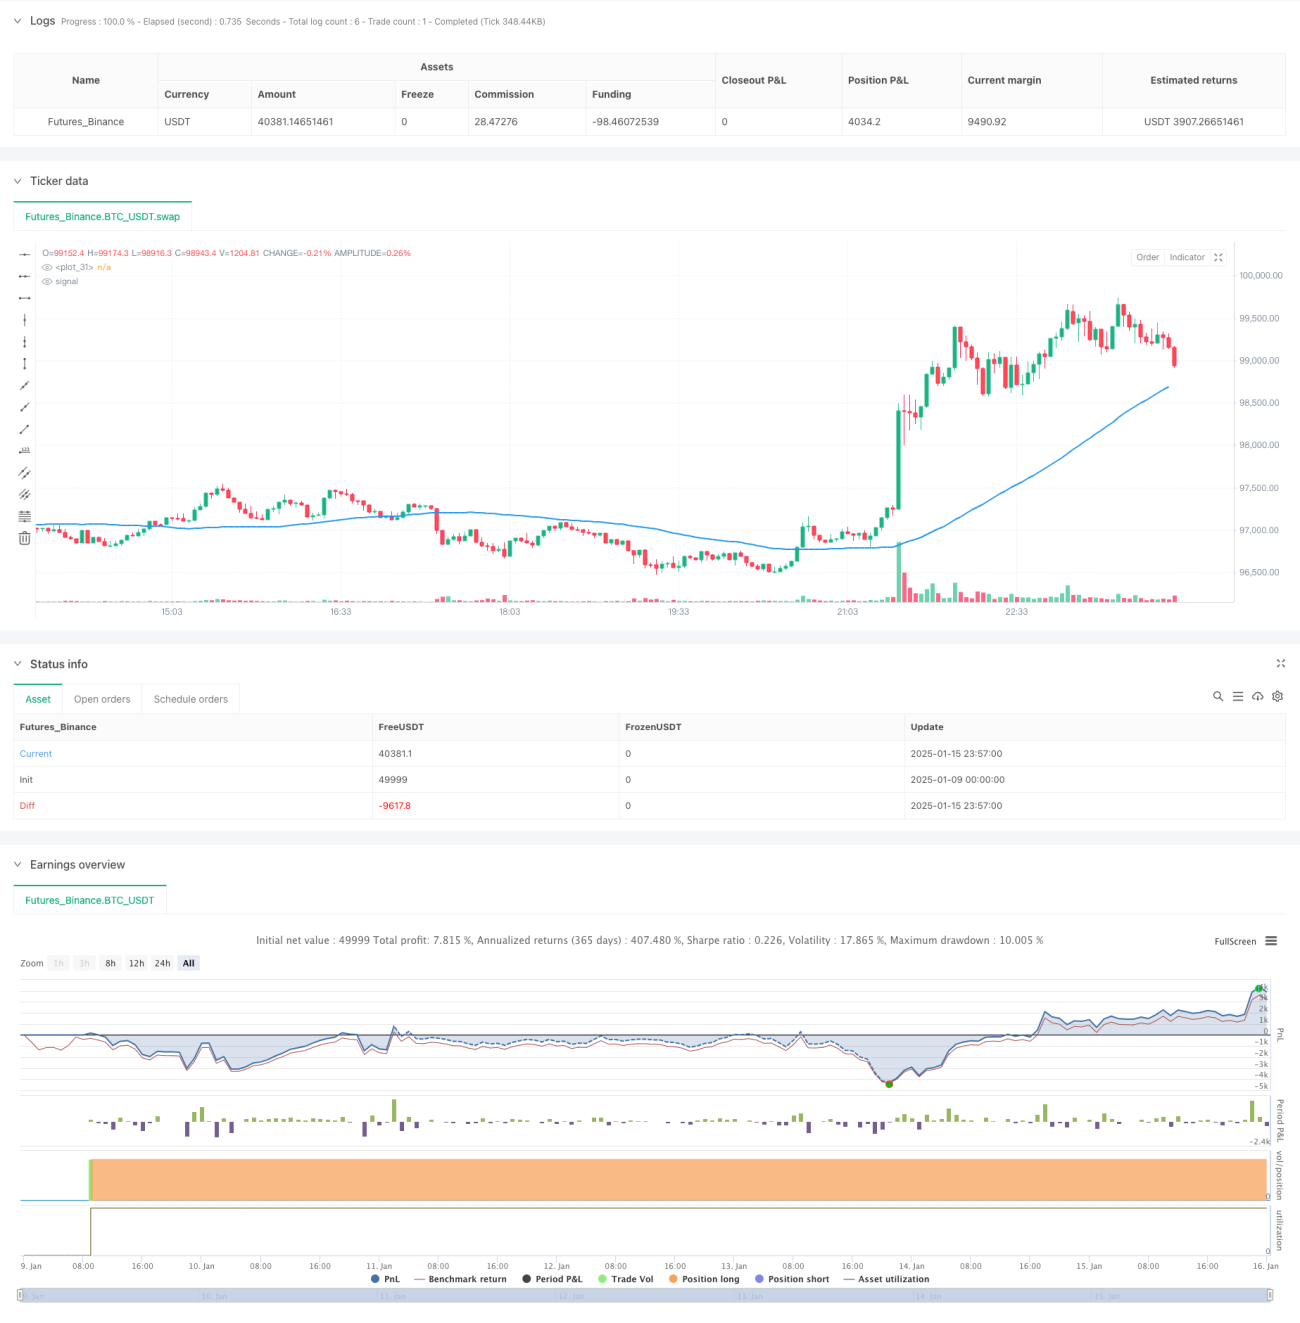
/*backtest
start: 2025-01-09 00:00:00
end: 2025-01-16 00:00:00
period: 3m
basePeriod: 3m
exchanges: [{"eid":"Futures_Binance","currency":"BTC_USDT","balance":49999}]
*/

//@version=5
strategy("Buy above 60-day MA, Sell at year-end", overlay=true, pyramiding=1)

// Define inputs for start and end dates- 1