基于波动率止损的均线趋势跟踪交易策略

EMA ATR MACD RSI MFI CCI ROC
创建日期: 2025-01-17 15:06:09 最后修改: 2025-01-17 15:06:09
复制: 0 点击次数: 147
avatar of ChaoZhang ChaoZhang
1
关注
1259
关注者

基于波动率止损的均线趋势跟踪交易策略

概述

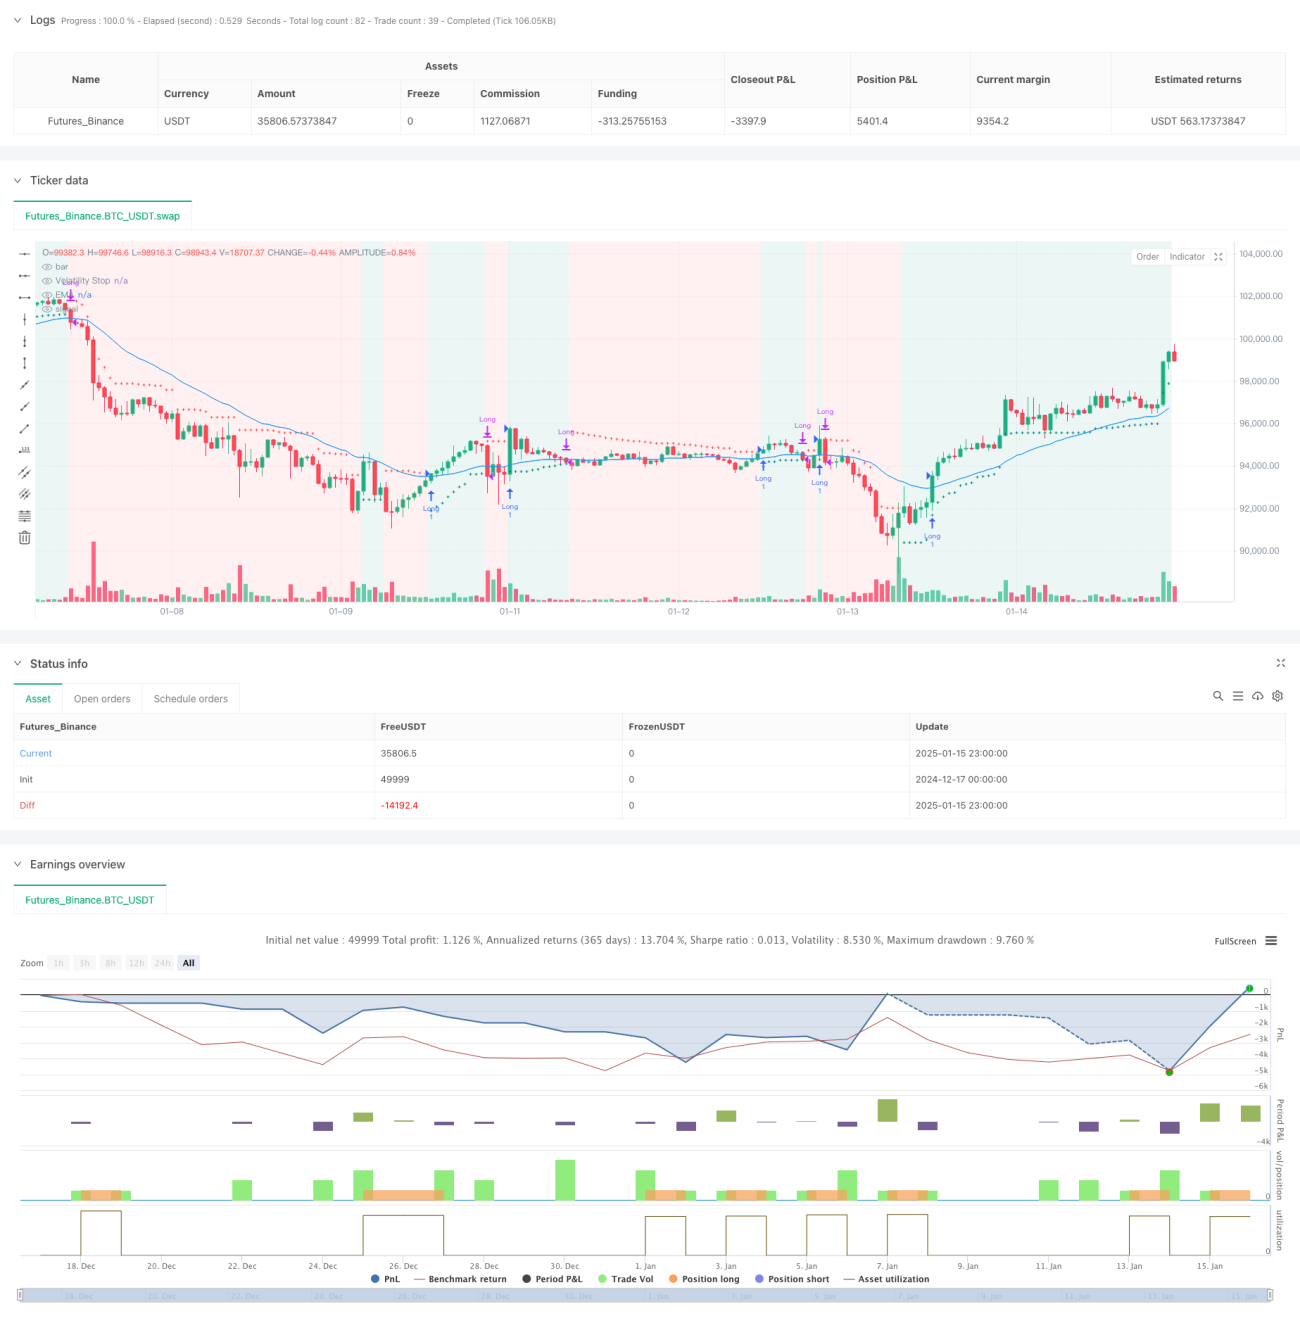
该策略是一个基于波动率止损(VStop)指标和指数移动平均线(EMA)的趋势跟踪交易系统。策略结合了Stan Weinstein的交易理念,通过动态调整的止损位来优化资金管理,同时利用EMA来确认趋势方向。这种组合为投资者和波段交易者提供了一个既能把握趋势又能有效管理风险的交易框架。

策略原理

策略的核心逻辑建立在两个主要技术指标之上: 1. 波动率止损(VStop):基于ATR(平均真实波幅)的动态止损指标,通过市场波动性来自适应地调整止损位置。当价格处于上升趋势时,止损线会随着价格上涨而上移;当趋势反转时,止损线会切换方向并重新计算。

  1. 指数移动平均线(EMA):作为趋势确认工具,帮助过滤虚假信号。价格需要站在EMA之上才会考虑开仓,这确保了交易方向与主趋势保持一致。

交易信号生成逻辑如下: - 开仓条件:价格位于VStop之上(处于上升趋势)且收盘价大于EMA - 平仓条件:当收盘价跌破EMA时 - 风险控制:通过动态调整的VStop提供实时的止损位置

策略优势

  1. 自适应性强:VStop基于市场实际波动性计算,能够根据不同市场环境自动调整止损距离
  2. 趋势跟踪能力出色:通过EMA确认趋势方向,避免在震荡市场频繁交易
  3. 风险管理完善:动态止损机制能够及时锁定利润,控制回撤
  4. 参数可调性强:可以根据不同交易品种和时间周期灵活调整VStop和EMA参数
  5. 逻辑简明清晰:策略规则直观易懂,便于实际操作执行

策略风险

  1. 趋势反转风险:在剧烈的趋势反转时可能会承受一定回撤后才能平仓
  2. 假突破风险:市场震荡时可能出现虚假的突破信号,导致频繁交易
  3. 参数敏感性:不同的参数设置可能导致策略表现差异较大
  4. 滑点风险:在市场流动性不足时,实际执行价格可能与理论价格有偏差
  5. 系统性风险:在市场剧烈波动时可能面临较大回撤

策略优化方向

  1. 增加趋势强度过滤器:可以引入ADX,MACD等指标来衡量趋势强度,仅在趋势明确时交易
  2. 优化止损机制:可以结合支撑位和阻力位来设置更智能的止损位置
  3. 加入成交量分析:通过成交量确认价格突破的有效性
  4. 引入市场环境识别:根据不同的市场环境(趋势/震荡)动态调整策略参数
  5. 完善仓位管理:基于波动率和风险评估来动态调整持仓规模

总结

该策略通过结合波动率止损和均线系统,构建了一个完整的趋势跟踪交易框架。策略的主要优势在于其自适应性和风险管理能力,但同时也需要注意市场环境对策略表现的影响。通过持续优化和完善,策略有望在不同市场环境下都能保持稳定的表现。建议交易者在实盘使用前,充分测试参数设置并结合自身风险承受能力来调整策略。

策略源码
/*backtest
start: 2024-12-17 00:00:00
end: 2025-01-16 00:00:00
period: 1h
basePeriod: 1h
exchanges: [{"eid":"Futures_Binance","currency":"BTC_USDT","balance":49999}]
*/

//@version=5
strategy("VStop + EMA Strategy", overlay=true)

// VStop Parameters
length = input.int(20, "VStop Length", minval=2)
multiplier = input.float(2.0, "VStop Multiplier", minval=0.25, step=0.25)

// EMA Parameters
emaLength = input.int(30, "EMA Length", minval=1)

// VStop Calculation
volStop(src, atrlen, atrfactor) =>
    if not na(src)
        var max     = src
        var min     = src
        var uptrend = true
        var float stop    = na
        atrM        = nz(ta.atr(atrlen) * atrfactor, ta.tr)
        max         := math.max(max, src)
        min         := math.min(min, src)
        stop        := nz(uptrend ? math.max(stop, max - atrM) : math.min(stop, min + atrM), src)
        uptrend     := src - stop >= 0.0
        if uptrend != uptrend[1] and not barstate.isfirst
            max    := src
            min    := src
            stop   := uptrend ? max - atrM : min + atrM
        [stop, uptrend]

// Calculate VStop
[vStop, isUptrend] = volStop(close, length, multiplier)

// Plot VStop
plot(vStop, "Volatility Stop", style=plot.style_cross, color=isUptrend ? color.teal : color.red)

// Calculate 30 EMA
emaValue = ta.ema(close, emaLength)
plot(emaValue, "EMA", color=color.blue)

// Entry and Exit Conditions
longCondition = isUptrend and close > emaValue
exitCondition = close <= emaValue

// Strategy Execution
if longCondition and not strategy.opentrades
    strategy.entry("Long", strategy.long)
if exitCondition and strategy.opentrades
    strategy.close("Long")

// Display Strategy Info
bgcolor(isUptrend ? color.new(color.teal, 90) : color.new(color.red, 90), title="Trend Background")
相关推荐