Adaptive Multi-Strategy Dynamic Switching System: A Quantitative Trading Strategy Combining Trend Following and Range Oscillation

Overview
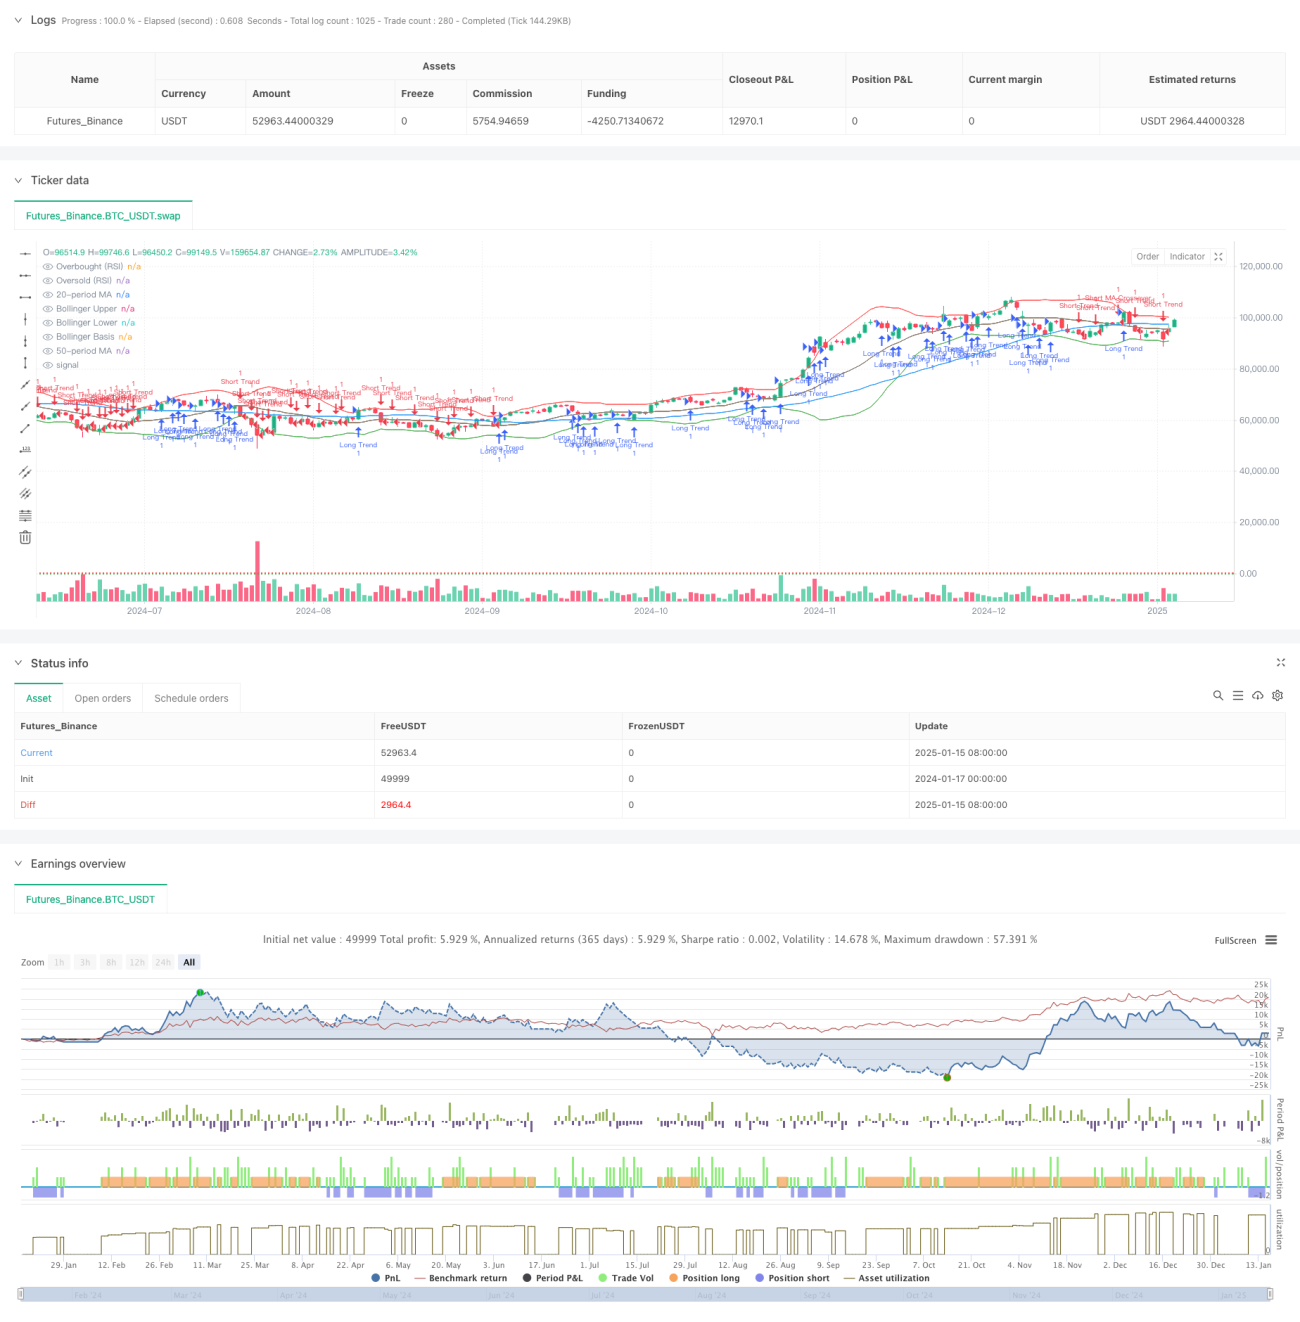
This strategy is an adaptive trading system that combines multiple technical analysis indicators and switches between different trading strategies by dynamically identifying market conditions. The system is primarily based on Moving Average (MA), Bollinger Bands (BB), and Relative Strength Index (RSI), automatically selecting the most suitable trading method according to market trends and range oscillation characteristics. The strategy implements differentiated risk management solutions for trending and ranging markets by setting different take-profit and stop-loss parameters.
Strategy Principle
The strategy uses 50-period and 20-period moving averages to determine market trends, combined with Bollinger Bands and RSI to identify overbought and oversold areas. In trending markets, the system mainly trades based on price relationship with the slow moving average and crossovers between fast and slow lines; in ranging markets, it primarily trades on Bollinger Bands breakouts and RSI overbought/oversold signals. The system automatically adjusts take-profit levels according to market conditions, using 6% for trending markets and 4% for ranging markets, with a uniform 2% stop-loss for risk control.
Strategy Advantages
- Strong market adaptability: Automatically switches trading strategies based on different market environments, improving system stability
- Comprehensive risk management: Applies different take-profit ratios for trending and ranging markets, better matching market characteristics
- Multi-dimensional signal verification: Improves trading signal reliability through cross-validation of multiple technical indicators
- High degree of automation: Fully automated operation without manual intervention, reducing errors from subjective judgment
Strategy Risks
- Parameter sensitivity: Strategy performance is affected by the selection of multiple technical indicator parameters, requiring thorough parameter optimization
- Market transition lag: Market state identification may have latency, affecting strategy performance
- False signal risk: May generate false trading signals in volatile markets
- Transaction cost considerations: Frequent strategy switching may result in high trading costs
Strategy Optimization Directions
- Incorporate volume indicators: Add volume analysis to existing technical indicators to improve signal reliability
- Optimize market state identification: Consider introducing trend strength indicators like ATR and ADX to improve market state judgment accuracy
- Dynamic parameter adjustment: Automatically adjust take-profit and stop-loss parameters based on market volatility to improve strategy adaptability
- Add filtering mechanisms: Design stricter trading conditions to reduce false signals
Summary
This strategy builds an adaptive trading system capable of adapting to different market environments by combining multiple classic technical indicators. While maintaining operational simplicity, the system achieves dynamic market state identification and automatic trading strategy switching, demonstrating strong practicality. Through differentiated take-profit and stop-loss settings, the strategy maintains good profitability while controlling risks. Strategy stability and reliability can be further enhanced by introducing more technical indicators and optimizing parameter adjustment mechanisms.
- 1