
Overview
This is a quantitative trading strategy that combines the Relative Strength Index (RSI) with multiple moving averages. The strategy primarily identifies market trends by monitoring crossover signals between different types of moving averages (including SMA, EMA, WMA, and SMMA) on the RSI indicator, while using RSI's overbought and oversold zones as supplementary decision criteria.
Strategy Principles
The strategy includes several key calculation steps:
- Calculate 14-period RSI with overbought level at 70 and oversold level at 30
- Calculate three different moving averages on the RSI curve:
- MA1: 20-period, choice of SMA/EMA/WMA/SMMA
- MA2: 50-period, choice of SMA/EMA/WMA/SMMA
- MA3: 100-period, choice of SMA/EMA/WMA/SMMA
- Trading signal generation rules:
- Buy signal: When MA2 crosses above MA3
- Sell signal: When MA2 crosses below MA3
- Simultaneously detect RSI divergences for additional reference
Strategy Advantages
- Multiple technical indicator cross-validation improves signal reliability
- Flexible moving average types and parameters
- RSI divergence detection helps identify market turning points early
- Percentage-based position management for effective risk control
- Excellent visualization for analysis and backtesting
Strategy Risks
- Moving average crossovers may have lag effects
- False signals may occur in ranging markets
- RSI distortion under certain market conditions
- Improper parameter selection may lead to excessive or insufficient trading signals
Risk mitigation:
- Recommend cross-validation with market trends and volume
- Optimize trading frequency through moving average parameter adjustment
- Set stop-loss and take-profit levels for risk control
Strategy Optimization Directions
- Signal filtering optimization:
- Add trend confirmation indicators
- Incorporate volume analysis
- Parameter dynamic optimization:
- Automatically adjust RSI and MA parameters based on market volatility
- Introduce adaptive period calculation methods
- Risk control optimization:
- Develop dynamic stop-loss and take-profit mechanisms
- Design dynamic position management system
Summary
The strategy builds an adaptive trading system by combining RSI and multiple moving averages. Its core advantages lie in the cross-validation of multiple technical indicators and flexible parameter configuration, while attention must be paid to moving average lag and market condition impacts on strategy performance. Through continuous optimization and risk control, this strategy shows promise for stable performance in actual trading.
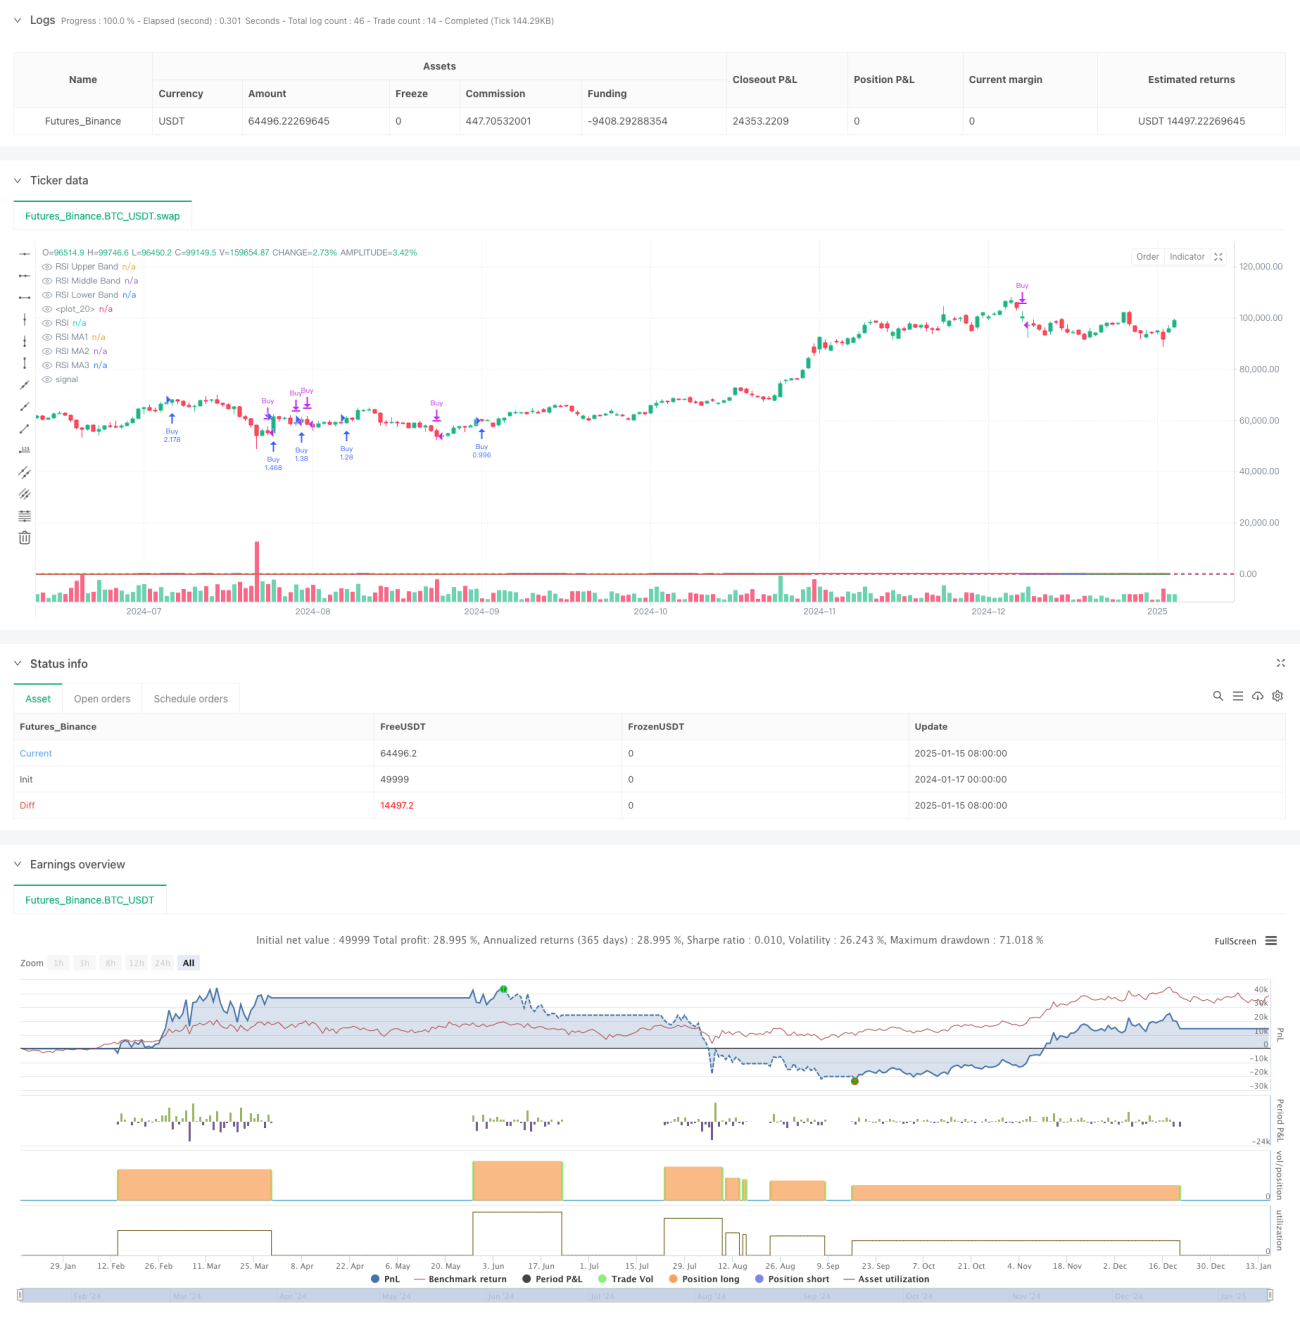
/*backtest
start: 2024-01-17 00:00:00
end: 2025-01-16 00:00:00
period: 1d
basePeriod: 1d
exchanges: [{"eid":"Futures_Binance","currency":"BTC_USDT","balance":49999}]
*/

//@version=6
strategy(title="Relative Strength Index with MA Strategy", shorttitle="RSI-MA Strategy", overlay=true, default_qty_type=strategy.percent_of_equity, default_qty_value=200)

// RSI Inputs- 1