Advanced Multi-Indicator Trend Confirmation Trading Strategy

Overview
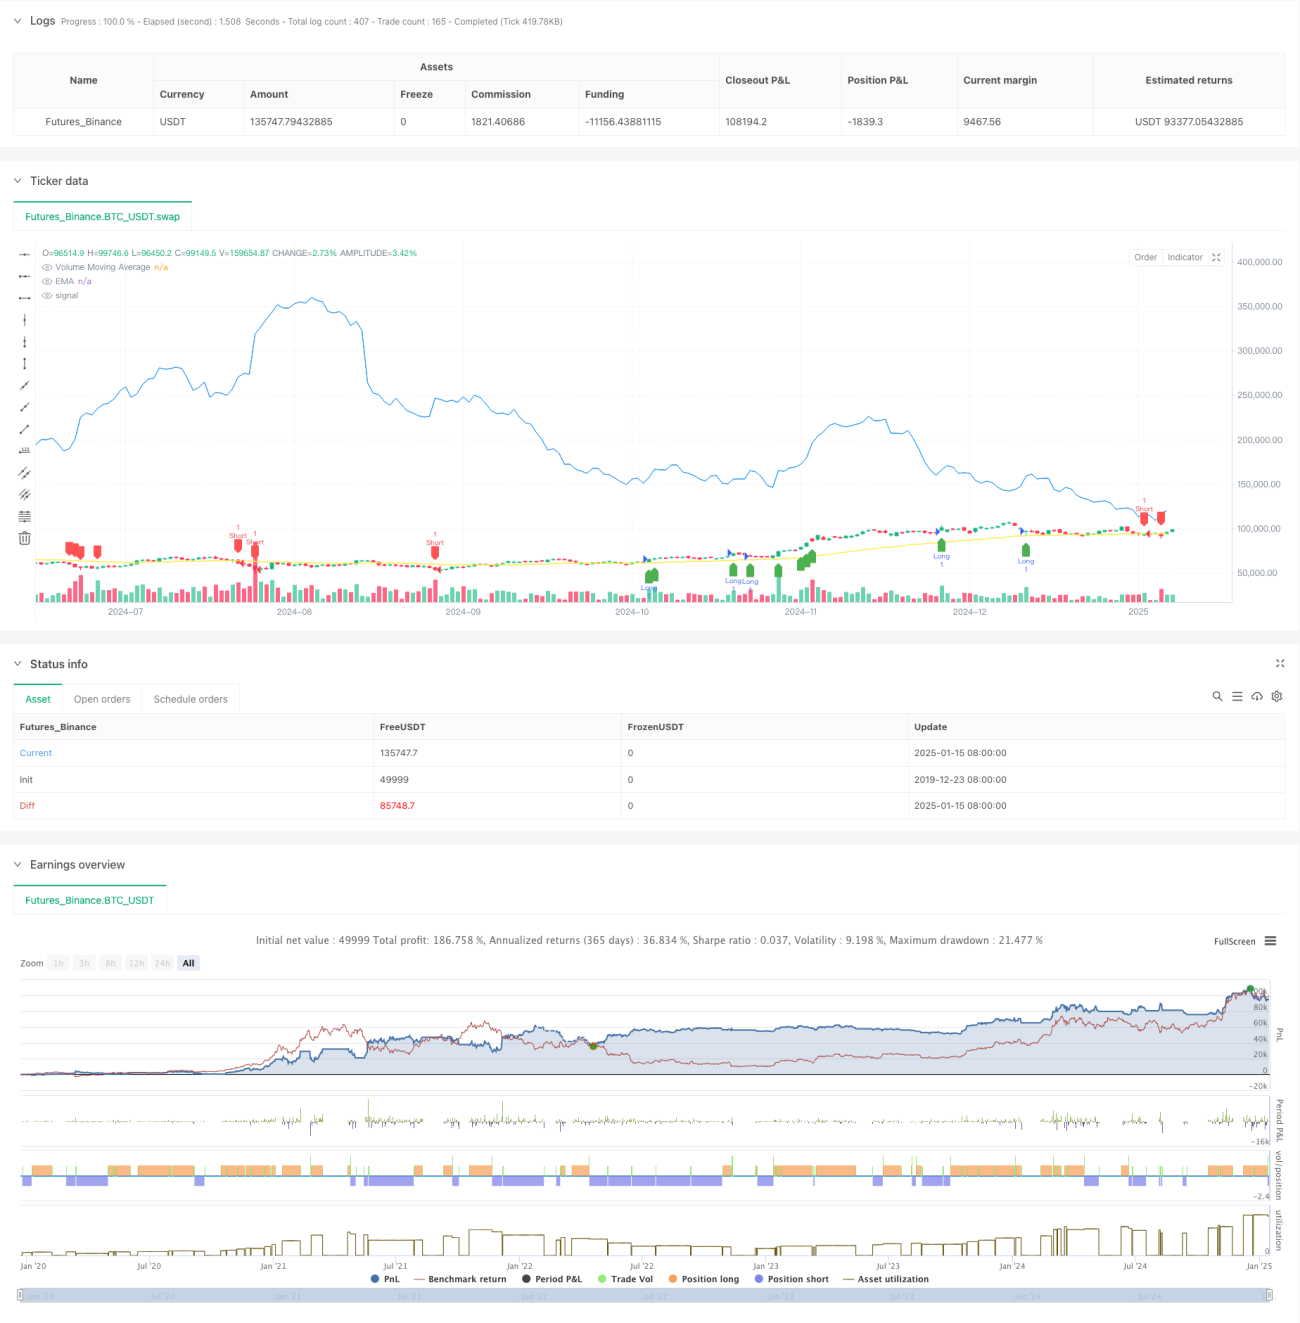
This is an advanced quantitative trading strategy that combines Exponential Moving Average (EMA), volume confirmation, and Average True Range (ATR). The strategy achieves accurate market trend capture through multiple technical indicators, enhances trade reliability through volume confirmation, and implements a comprehensive risk management system using dynamic ATR-based stop-loss and take-profit levels.
Strategy Principles
The core logic consists of three main components:
- Trend Determination: Uses EMA(50) as the primary trend indicator. An uptrend is identified when price is above EMA, and vice versa.
- Volume Confirmation: Calculates a 20-period Volume Moving Average, requiring current volume to exceed both 1.5 times the moving average and the previous period's volume to ensure sufficient market participation.
- Risk Management: Dynamically sets stop-loss and take-profit levels based on 14-period ATR. Stop-loss is set at 2x ATR and take-profit at 3x ATR, balancing capital protection with trend development potential.
Strategy Advantages
- Multiple Confirmation Mechanism: Dual confirmation through trend and volume significantly improves signal reliability.
- Dynamic Risk Management: ATR-based dynamic stop-loss and take-profit settings better adapt to market volatility changes.
- High Flexibility: Strategy parameters can be adjusted for different market conditions, providing strong adaptability.
- Clear Visualization: Strategy provides clear graphical signal display for intuitive judgment.
Strategy Risks
- Trend Reversal Risk: EMA may produce delayed signals during severe market fluctuations.
- False Volume Breakouts: High volume might indicate false breakouts under certain market conditions.
- Stop-Loss Range: The 2x ATR stop-loss setting might be too wide in some cases and may need adjustment.
Strategy Optimization Directions
- Introduce Trend Strength Indicator: Consider adding ADX or similar indicators to improve trend determination accuracy.
- Optimize Volume Filtering: Implement more sophisticated volume analysis methods like OBV or volume-weighted moving averages.
- Enhance Stop-Loss Mechanism: Consider adding trailing stops or support/resistance-based stop-loss methods.
- Add Time Filtering: Implement trading time filters to avoid false signals during low market activity periods.
Summary
This strategy establishes a logically rigorous trading system through the comprehensive use of multiple technical indicators. Its core strengths lie in its multiple confirmation mechanisms and dynamic risk management, while attention must be paid to risks such as trend reversals and false volume breakouts. Through continuous optimization and refinement, this strategy shows promise for improved performance in actual trading.
- 1