概述
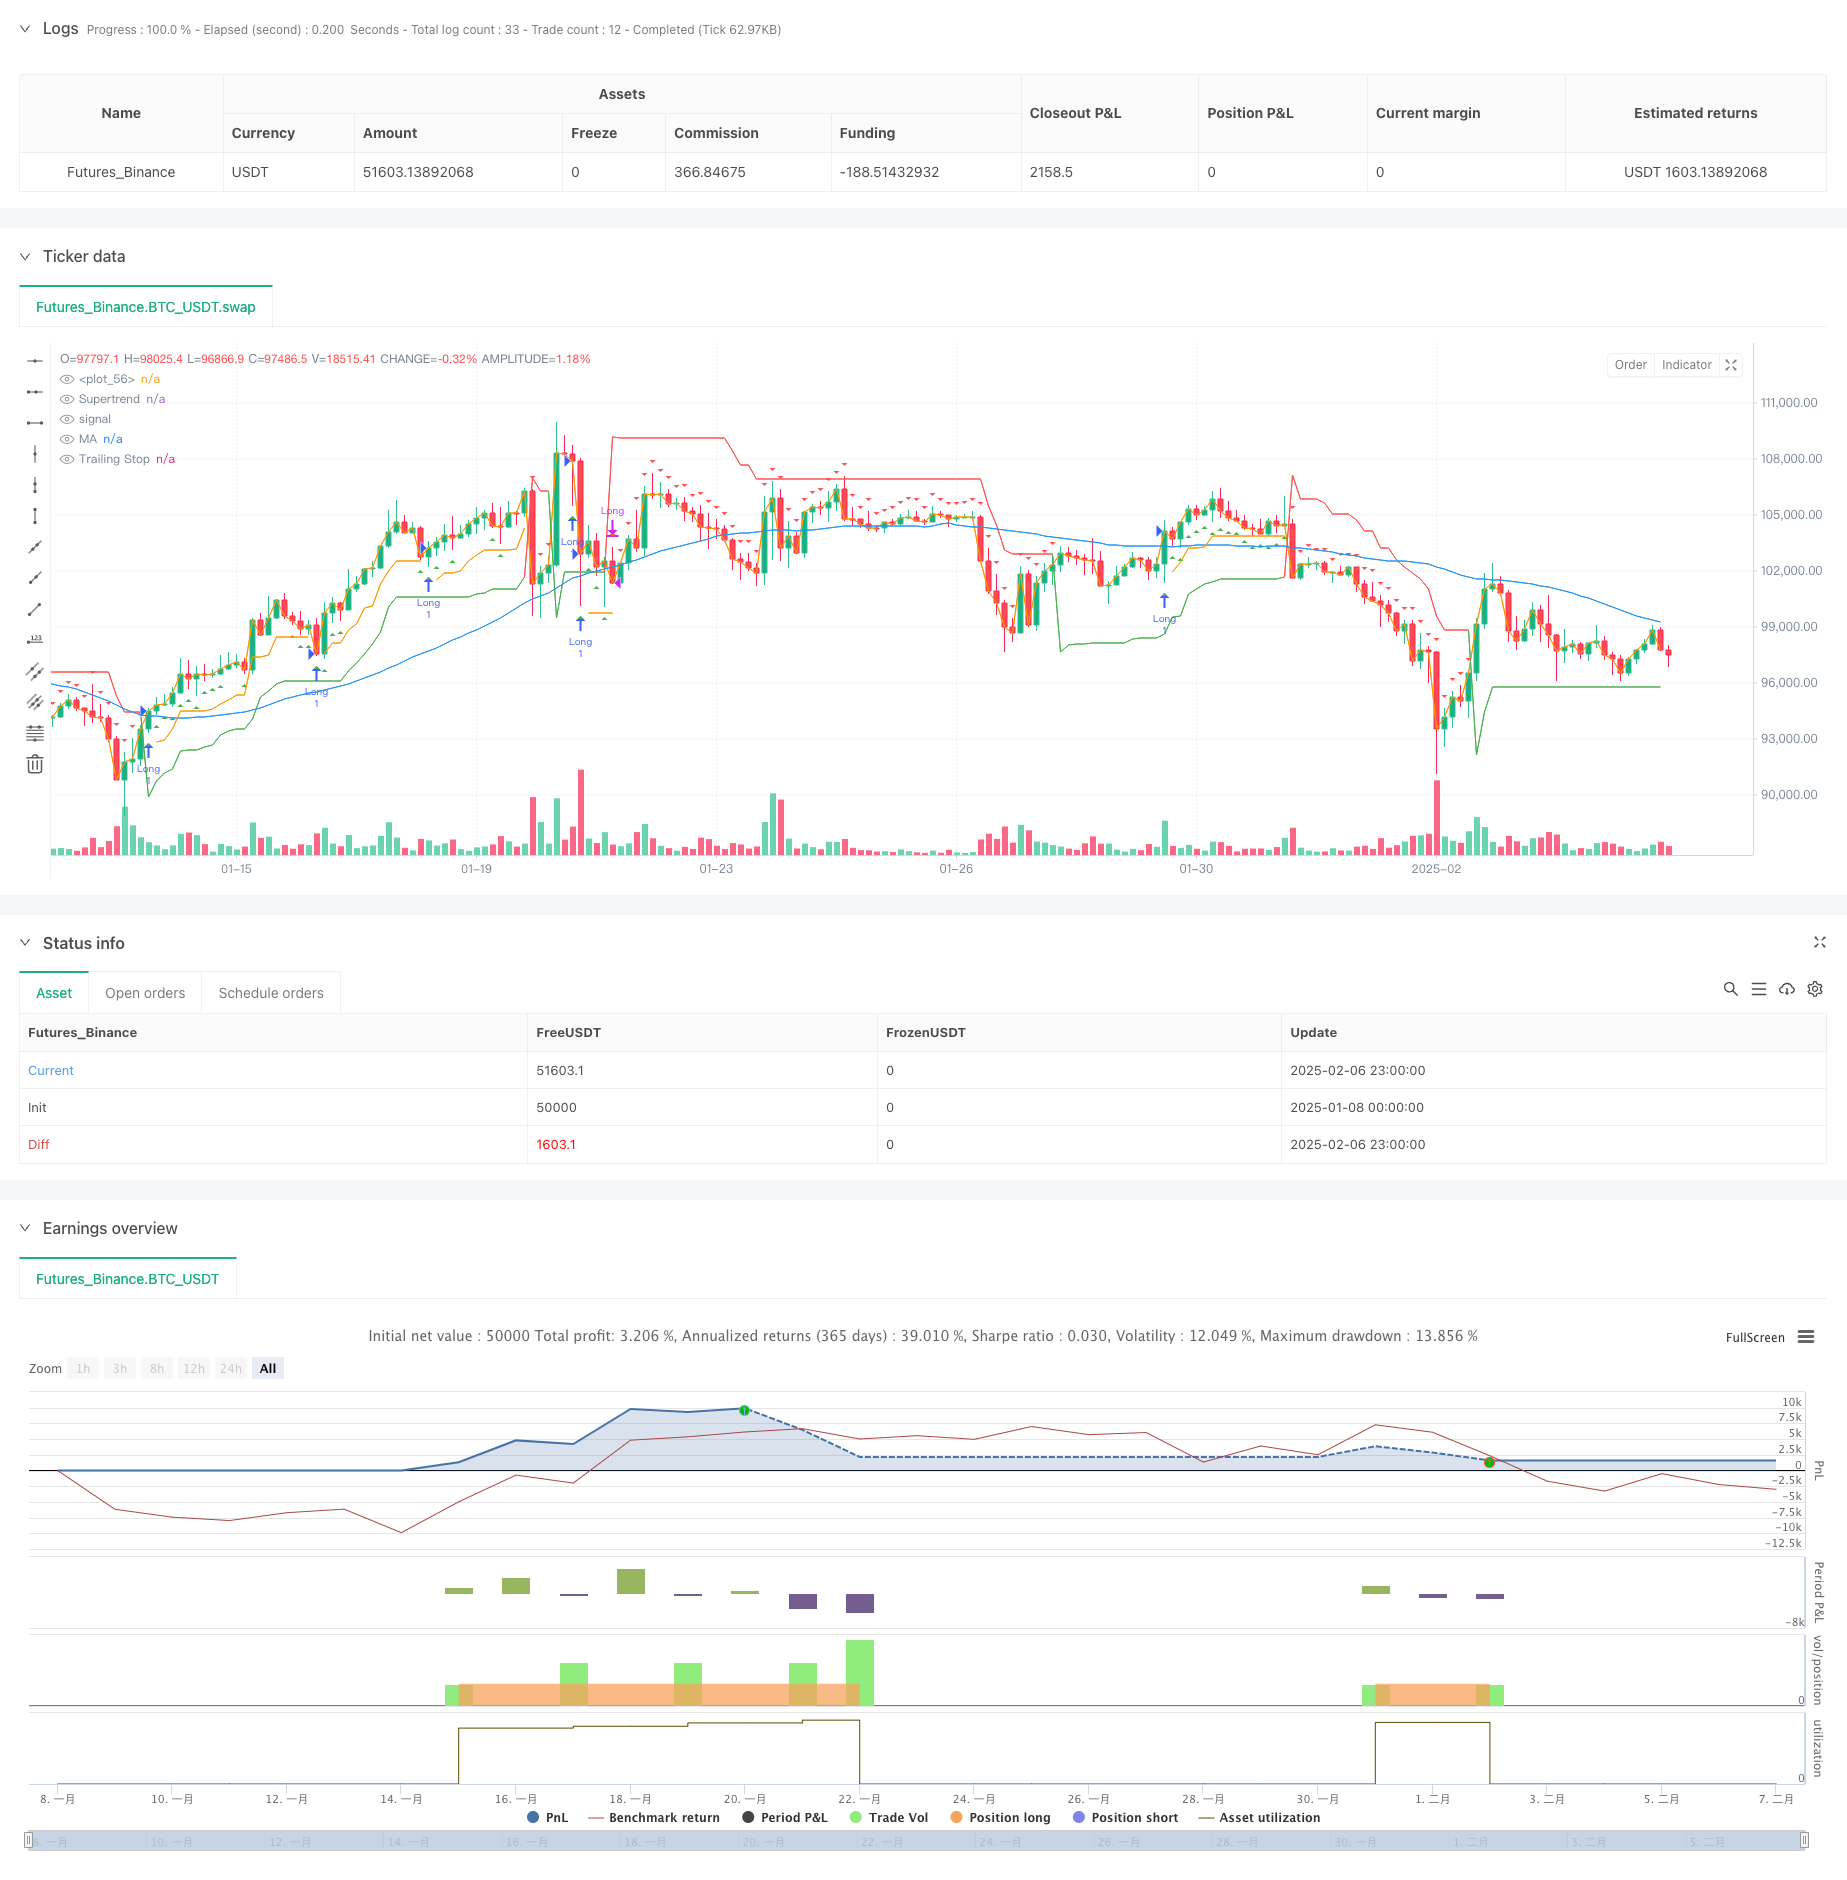
本策略是一个结合了趋势跟踪、动量指标和自适应止损的多维度交易系统。策略通过SuperTrend指标识别市场趋势方向,同时结合RSI动量指标和均线系统进行交易确认,并利用ATR波动率指标实现动态止损管理。这种多维度的分析方法能够有效地捕捉市场趋势,同时对风险进行合理控制。
策略原理
策略的核心逻辑基于以下三个维度: 1. 趋势识别:使用SuperTrend指标(参数:ATR长度14,乘数3.0)作为主要趋势判断工具。当SuperTrend转为绿色时,表明市场可能处于上升趋势。 2. 动量确认:使用RSI指标(参数:长度14)避免在过度买入区域开仓。RSI低于65时认为市场未处于超买状态。 3. 趋势验证:使用50周期简单移动平均线(SMA)作为额外的趋势确认工具。价格需要位于均线之上才考虑开仓。
买入条件需同时满足:SuperTrend看涨(绿色)+RSI<65+价格在50周期均线之上。 卖出条件:当SuperTrend转为看跌时平仓。 止损管理:使用基于ATR的追踪止损,止损距离为ATR值的1.5倍。
策略优势
- 多维度分析:通过结合多个技术指标,提高了交易信号的可靠性。
- 自适应性强:ATR基础的止损设置能够根据市场波动性自动调整止损距离。
- 风险控制完善:采用追踪止损机制,可以在保护利润的同时给予趋势充分发展空间。
- 指标参数合理:各项指标的参数设置符合市场规律,如RSI的65作为过滤阈值比传统的70更保守。
- 代码结构清晰:策略代码模块化程度高,便于维护和优化。
策略风险
- 震荡市场风险:在区间震荡市场中可能频繁触发假信号。
- 滑点风险:在快速行情中,追踪止损可能因滑点导致实际止损价格偏离预期。
- 参数敏感性:策略表现对SuperTrend和RSI的参数设置较为敏感。
- 延迟风险:移动平均线等滞后指标可能导致入场和出场存在一定延迟。
策略优化方向
- 市场环境适应性:可添加波动率过滤器,在高波动率环境下调整止损倍数。
- 入场优化:可考虑添加成交量确认指标,提高入场信号的可靠性。
- 仓位管理:引入基于ATR的动态仓位管理系统,实现风险敞口的自适应调整。
- 时间框架优化:可测试在不同时间框架上的表现,选择最优时间周期。
- 参数动态调整:研究参数动态优化方法,提高策略在不同市场环境下的适应性。
总结
该策略通过综合运用趋势跟踪、动量和均线系统,构建了一个逻辑完整的交易系统。策略的优势在于多维度的信号确认机制和完善的风险控制体系。通过提供的优化方向,策略还有进一步提升的空间。重点是要在保持策略核心逻辑的同时,增强其在不同市场环境下的适应性。
策略源码
/*backtest
start: 2025-01-08 00:00:00
end: 2025-02-07 00:00:00
period: 3h
basePeriod: 3h
exchanges: [{"eid":"Futures_Binance","currency":"BTC_USDT"}]
*/

// This Pine Script™ code is subject to the terms of the Mozilla Public License 2.0 at https://mozilla.org/MPL/2.0/
// © Gladston_J_G

//@version=5
strategy("Trend Strategy with Stop Loss", overlay=true, margin_long=100, margin_short=100)

// ———— Inputs ———— //
atrLength = input(14, "ATR Length")
supertrendMultiplier = input(3.0, "Supertrend Multiplier")
rsiLength = input(14, "RSI Length")
maLength = input(50, "MA Length")
trailOffset = input(1.5, "Trailing Stop ATR Multiplier")

// ———— Indicators ———— //
// Supertrend for trend direction
[supertrend, direction] = ta.supertrend(supertrendMultiplier, atrLength)

// RSI for momentum filter

rsi = ta.rsi(close, rsiLength)

// Moving Average for trend confirmation
ma = ta.sma(close, maLength)

// ATR for volatility-based stop loss
atr = ta.atr(atrLength)

// ———— Strategy Logic ———— //
// Buy Signal: Supertrend bullish + RSI not overbought + Price above MA
buyCondition = direction < 0 and rsi < 65 and close > ma

// Sell Signal: Supertrend turns bearish
sellCondition = direction > 0

// ———— Stop Loss & Trailing ———— //
stopPrice = close - (atr * trailOffset)
var float trail = na
if buyCondition and strategy.position_size == 0
    trail := stopPrice
else
    trail := math.max(stopPrice, nz(trail[1]))

// ———— Execute Orders ———— //
strategy.entry("Long", strategy.long, when=buyCondition)
strategy.close("Long", when=sellCondition)
strategy.exit("Trail Exit", "Long", stop=trail)

// ———— Visuals ———— //
plot(supertrend, "Supertrend", color=direction < 0 ? color.green : color.red)
plot(ma, "MA", color=color.blue)
plot(strategy.position_size > 0 ? trail : na, "Trailing Stop", color=color.orange, style=plot.style_linebr)

// ———— Alerts ———— //
plotshape(buyCondition, "Buy", shape.triangleup, location.belowbar, color.green, size=size.small)
plotshape(sellCondition, "Sell", shape.triangledown, location.abovebar, color.red, size=size.small)
plot(close)
相关推荐