概述
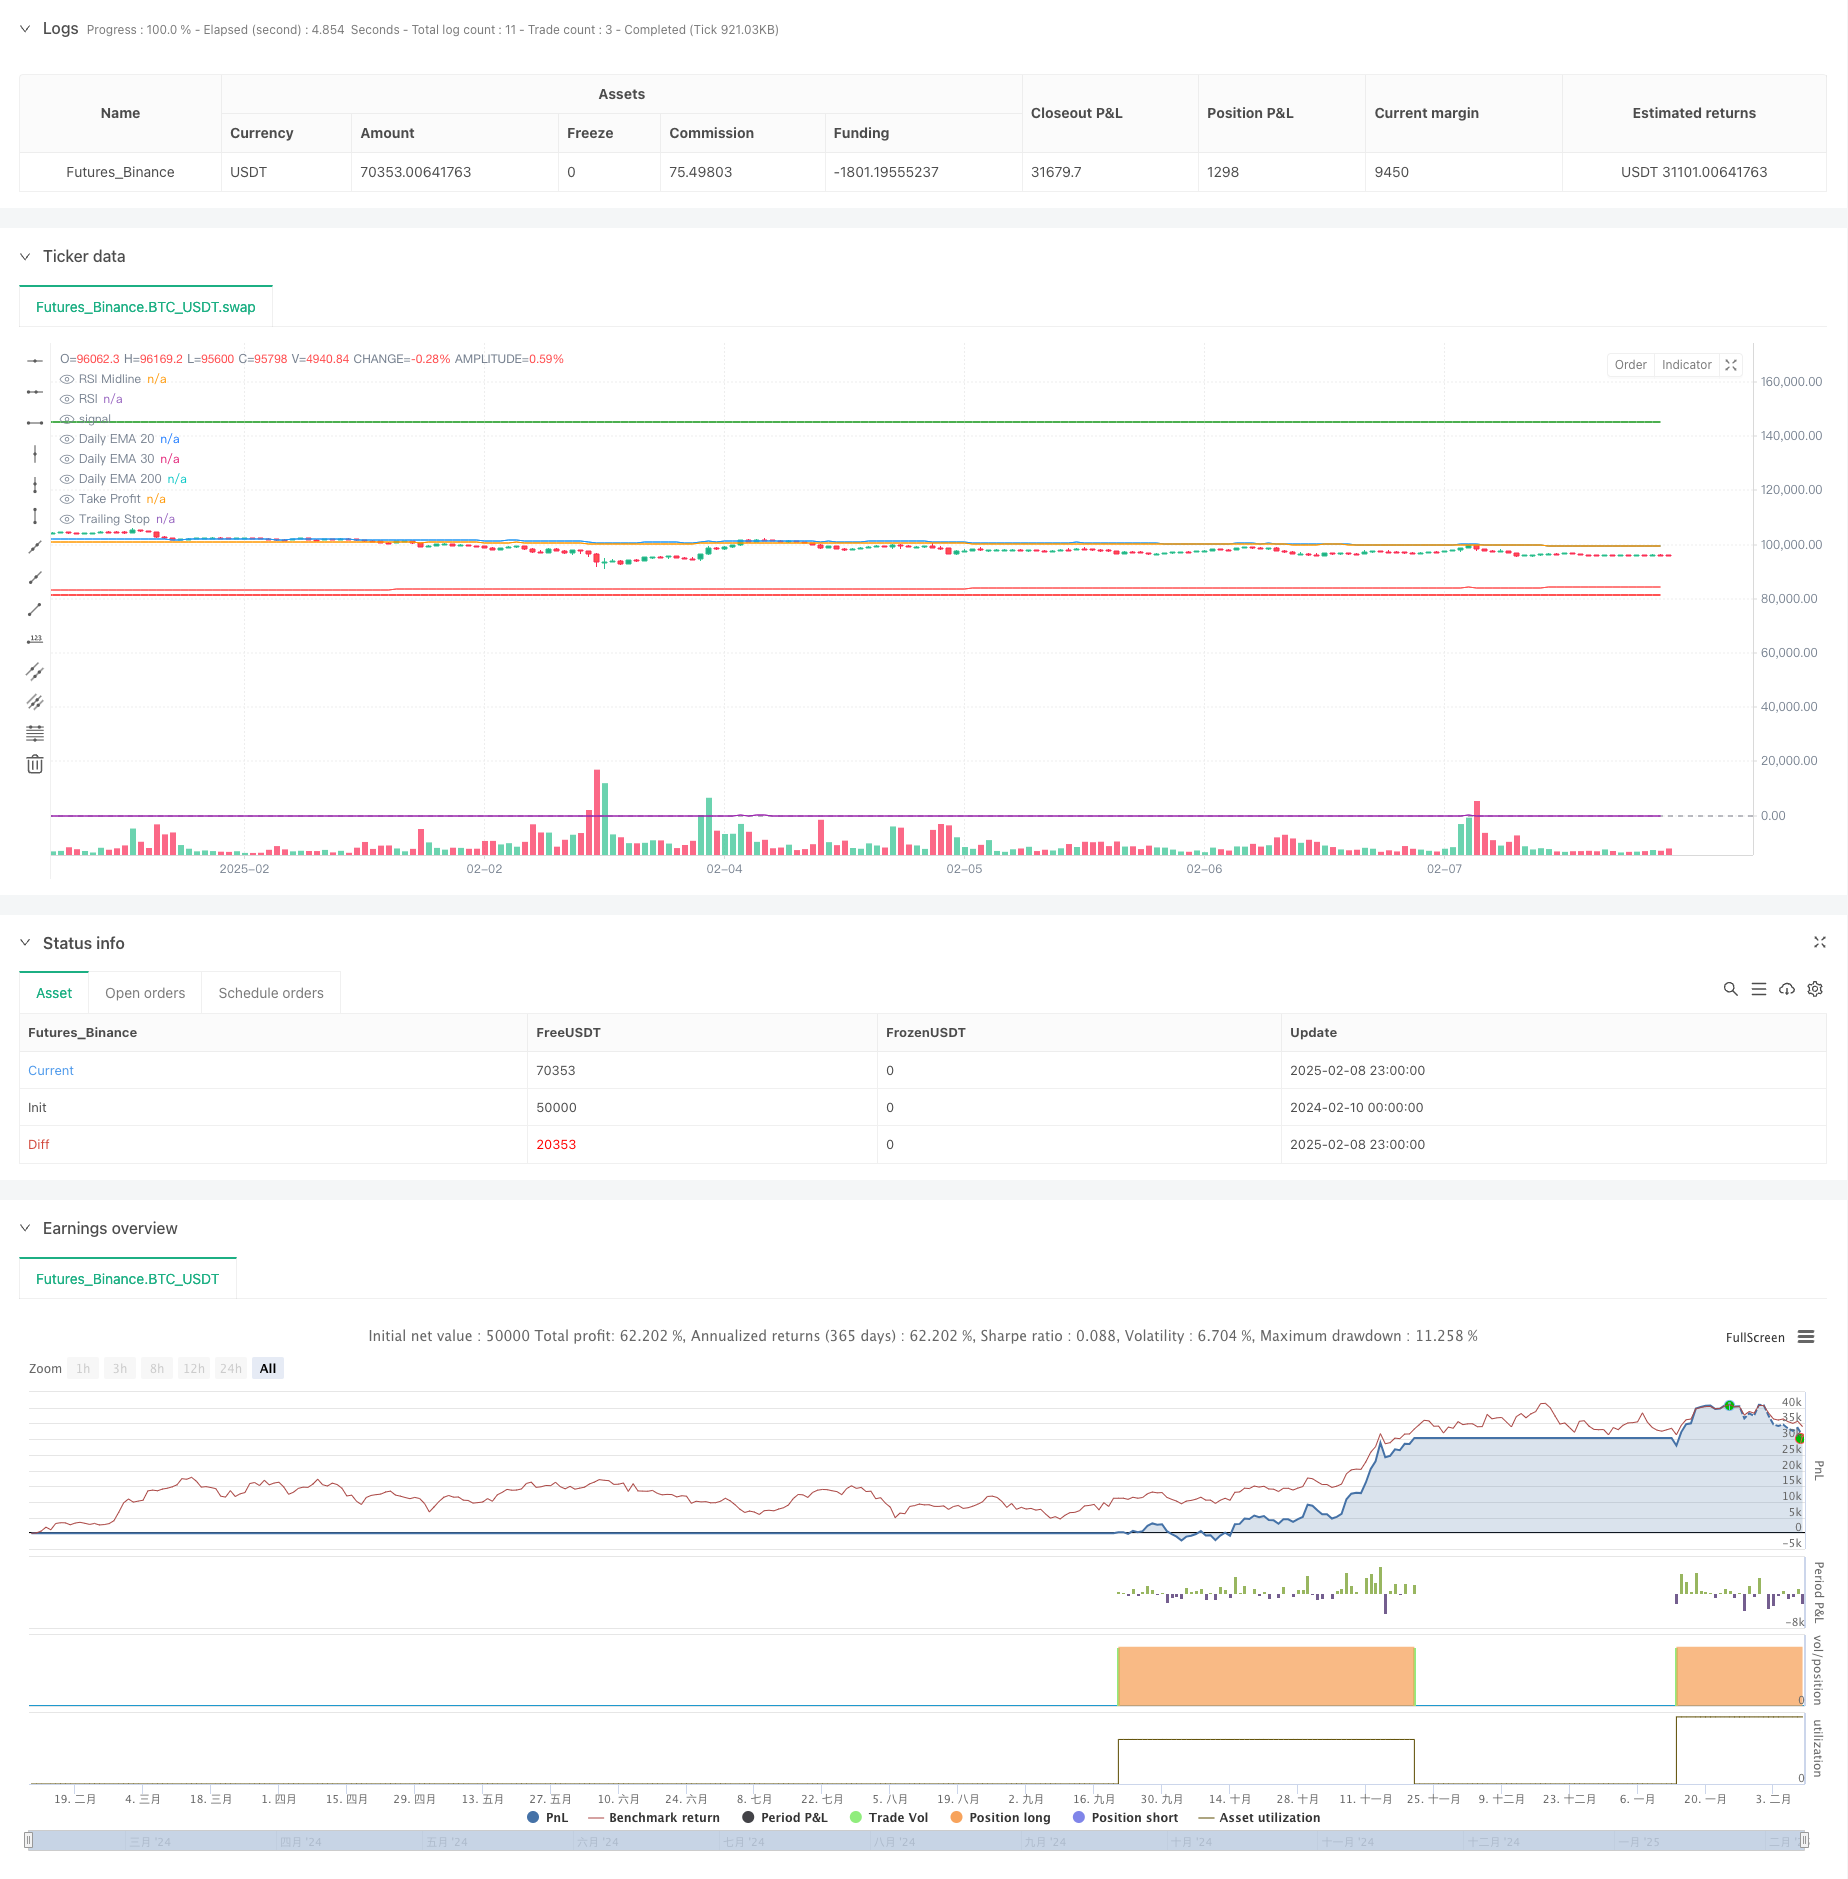
该策略是一个基于多重指数移动平均线(EMA)和相对强弱指标(RSI)的趋势跟踪交易系统。策略结合了日线级别的EMA(20,30,200)交叉信号、RSI动量确认以及动态止损机制,旨在捕捉市场中长期趋势性机会。
策略原理
策略的核心逻辑包含以下几个关键组成部分: 1. 入场信号:当日线20日EMA向上穿越30日EMA,且价格位于200日EMA之上,同时RSI大于50时,系统产生做多信号。 2. 止盈设置:入场后设置50%的固定止盈位。 3. 动态止损:采用25%的动态跟踪止损,随着价格创新高而上移止损位置。 4. 退场机制:当价格触及止盈位或跟踪止损位时,自动平仓结束交易。
策略优势
- 多重时间周期验证:通过日线级别的均线组合来过滤短期波动,提高交易稳定性。
- 动态风险管理:跟踪止损机制可以有效锁定盈利,避免大幅回撤。
- 趋势确认充分:RSI指标与均线系统相结合,能够更好地确认趋势的有效性。
- 执行逻辑清晰:入场和出场条件明确,易于理解和操作。
策略风险
- 震荡市场风险:在横盘震荡市场中可能频繁触发止损。
- 滑点影响:在市场波动剧烈时,动态止损和止盈位可能面临较大滑点。
- 假突破风险:均线交叉信号可能出现假突破情况。
- 参数敏感性:止损和止盈百分比的设置对策略表现影响较大。
策略优化方向
- 市场环境过滤:可添加波动率指标(如ATR)来判断市场环境,在震荡市场降低仓位或暂停交易。
- 止盈动态化:考虑根据市场波动情况动态调整止盈比例。
- 入场信号优化:可引入成交量指标来配合均线交叉信号,提高信号可靠性。
- 仓位管理完善:引入动态仓位管理机制,根据市场风险度自动调整开仓规模。
总结
该策略通过多重技术指标的协同配合,构建了一个完整的趋势跟踪交易系统。策略的主要特点是结合了中长期趋势判断与动态风险控制,适合在趋势明确的市场环境中运行。通过持续优化和完善,策略有望在实际交易中取得更好的表现。
策略源码
/*backtest
start: 2024-02-10 00:00:00
end: 2025-02-09 00:00:00
period: 1h
basePeriod: 1h
exchanges: [{"eid":"Futures_Binance","currency":"BTC_USDT"}]
*/

//@version=5
strategy("Talbuaia Signal", overlay=true)

// Request EMAs on the daily timeframe
ema20_daily = request.security(syminfo.tickerid, "D", ta.ema(close, 20), lookahead=barmerge.lookahead_on)
ema30_daily = request.security(syminfo.tickerid, "D", ta.ema(close, 30), lookahead=barmerge.lookahead_on)
ema200_daily = request.security(syminfo.tickerid, "D", ta.ema(close, 200), lookahead=barmerge.lookahead_on)

// RSI Calculation
rsi = ta.rsi(close, 14)

// Plot daily EMAs
plot(ema20_daily, color=color.blue, title="Daily EMA 20")
plot(ema30_daily, color=color.orange, title="Daily EMA 30")
plot(ema200_daily, color=color.red, title="Daily EMA 200")

// Plot RSI
hline(50, "RSI Midline", color=color.gray)
plot(rsi, color=color.purple, title="RSI")

// Entry condition: 20 EMA crosses above 30 EMA, price is above 200 EMA, and RSI > 50
bullishEntry = ta.crossover(ema20_daily, ema30_daily) and close > ema200_daily and rsi > 50

// Variables to track entry price, take profit, and trailing stop
var float entryPriceLong = na
var float highestPriceSinceEntry = na
var float takeProfitLevel = na
var float trailingStopLevel = na

// Entry Logic
if bullishEntry
    strategy.entry("Long", strategy.long)
    entryPriceLong := close
    highestPriceSinceEntry := close  // Initialize the highest price since entry
    takeProfitLevel := entryPriceLong * 1.50  // Set take profit at 50% above entry price
    trailingStopLevel := na  // Reset trailing stop
    label.new(bar_index, close, "BUY", style=label.style_label_up, color=color.green, textcolor=color.white)

// Update highest price and trailing stop dynamically
if strategy.position_size > 0
    highestPriceSinceEntry := math.max(highestPriceSinceEntry, close)  // Track the highest price reached
    trailingStopLevel := highestPriceSinceEntry * (1 - 0.25)  // Set trailing stop at 25% below the highest price

// Exit Logic: Take profit or trailing stop
if strategy.position_size > 0 and (close >= takeProfitLevel or close <= trailingStopLevel)
    strategy.close("Long")
    label.new(bar_index, close, "EXIT LONG", style=label.style_label_down, color=color.red, textcolor=color.white)

// Plot trailing stop and take profit levels on the chart
plot(trailingStopLevel, "Trailing Stop", color=color.red, linewidth=2, style=plot.style_line)
plot(takeProfitLevel, "Take Profit", color=color.green, linewidth=2, style=plot.style_line)
相关推荐