Multi-Indicator Trend Momentum Trading Strategy Based on SuperTrend

Overview
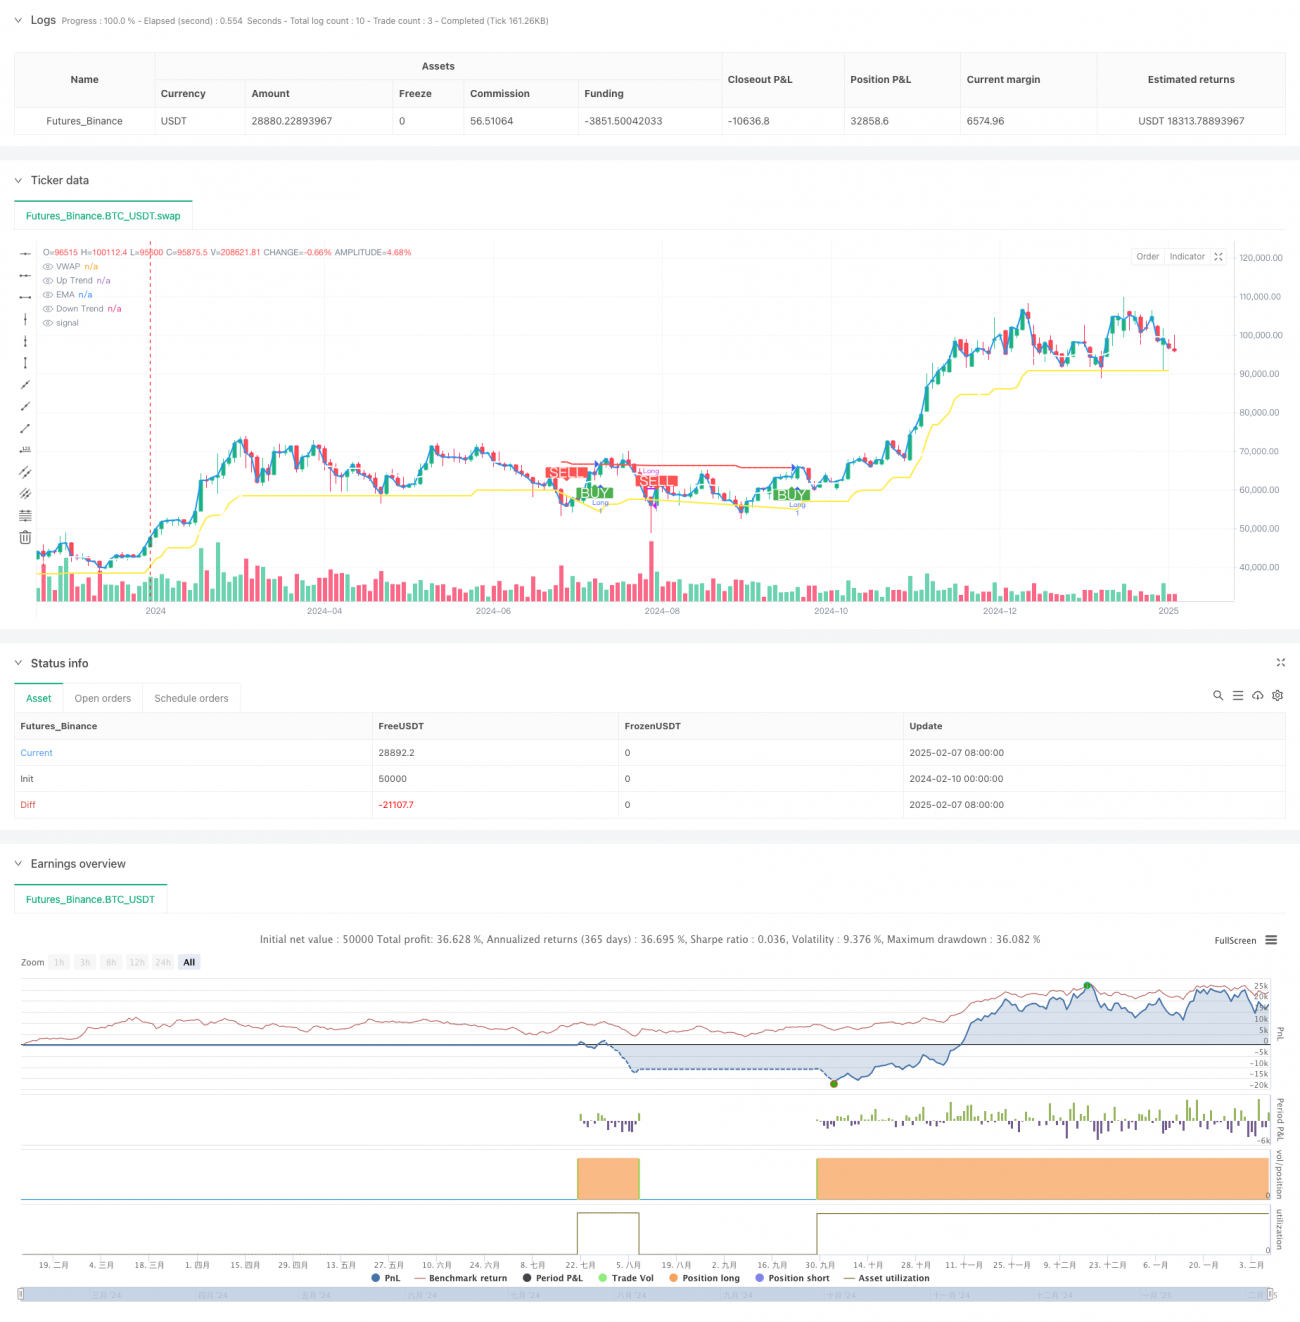
This is a trend-following trading strategy that combines multiple technical indicators including SuperTrend, VWAP, EMA, and ADX. The strategy primarily identifies trend direction through the SuperTrend indicator, confirms trends using the relationship between VWAP and EMA, and filters weak trends using the ADX indicator to provide high-accuracy trading signals. The strategy is designed for intraday trading, particularly on 5-minute, 15-minute, and 1-hour timeframes.
Strategy Principles
The core logic is based on the following key components:
- SuperTrend indicator calculation uses a 10-period ATR and 3.0 multiplier to determine trend direction. An uptrend (green) forms when price breaks above the upper band, and a downtrend (red) forms when price breaks below the lower band.
- 21-period EMA serves as dynamic support/resistance and works with VWAP to confirm trends. Bullish bias exists when VWAP is above EMA; bearish bias when below.
- ADX indicator measures trend strength - above 25 indicates strong trend and more reliable signals; below 25 indicates weak trend, requiring caution.
- Entry conditions include:
Buy Signal: SuperTrend turns green (uptrend confirmation), closing price above VWAP and EMA, ADX shows trend strength.
Sell Signal: SuperTrend turns red (downtrend confirmation), closing price below VWAP and EMA, ADX confirms downtrend strength.
Strategy Advantages
- Multiple indicator cross-validation improves trading signal accuracy and reduces false breakouts.
- ADX indicator filters weak trends, improving trade success rate.
- Strategy provides clear buy/sell signals with trend background color identification for easy execution.
- Parameters can be flexibly adjusted for different markets and trading instruments.
- Combines benefits of trend following and momentum trading for good returns in strong trend markets.
Strategy Risks
- May generate frequent false signals in oscillating markets, leading to consecutive losses.
- Multiple indicators may cause signal lag, affecting entry timing.
- ATR parameter settings significantly impact strategy performance; improper parameters may lead to over-filtering or insufficient signals.
- Strategy may not respond quickly enough in rapid reversal markets, causing drawdowns.
Strategy Optimization Directions
- Incorporate volume indicators to confirm price breakout validity.
- Consider adding stop-loss and take-profit functions to improve money management.
- Develop adaptive parameter mechanisms to automatically adjust ATR and ADX parameters based on market volatility.
- Add market environment recognition to automatically reduce positions or pause trading in oscillating markets.
- Introduce more market structure analysis tools like support/resistance levels and trendlines to improve trading precision.
Summary
This is a well-structured trend-following strategy with clear logic. The combination of multiple indicators effectively improves trading signal reliability. The strategy's strengths lie in its clear signals, ease of execution, and good scalability. However, careful attention must be paid to market environment selection and risk control in practical application. Through continuous optimization and improvement, this strategy has the potential to achieve stable returns in strongly trending markets.
- 1