概述
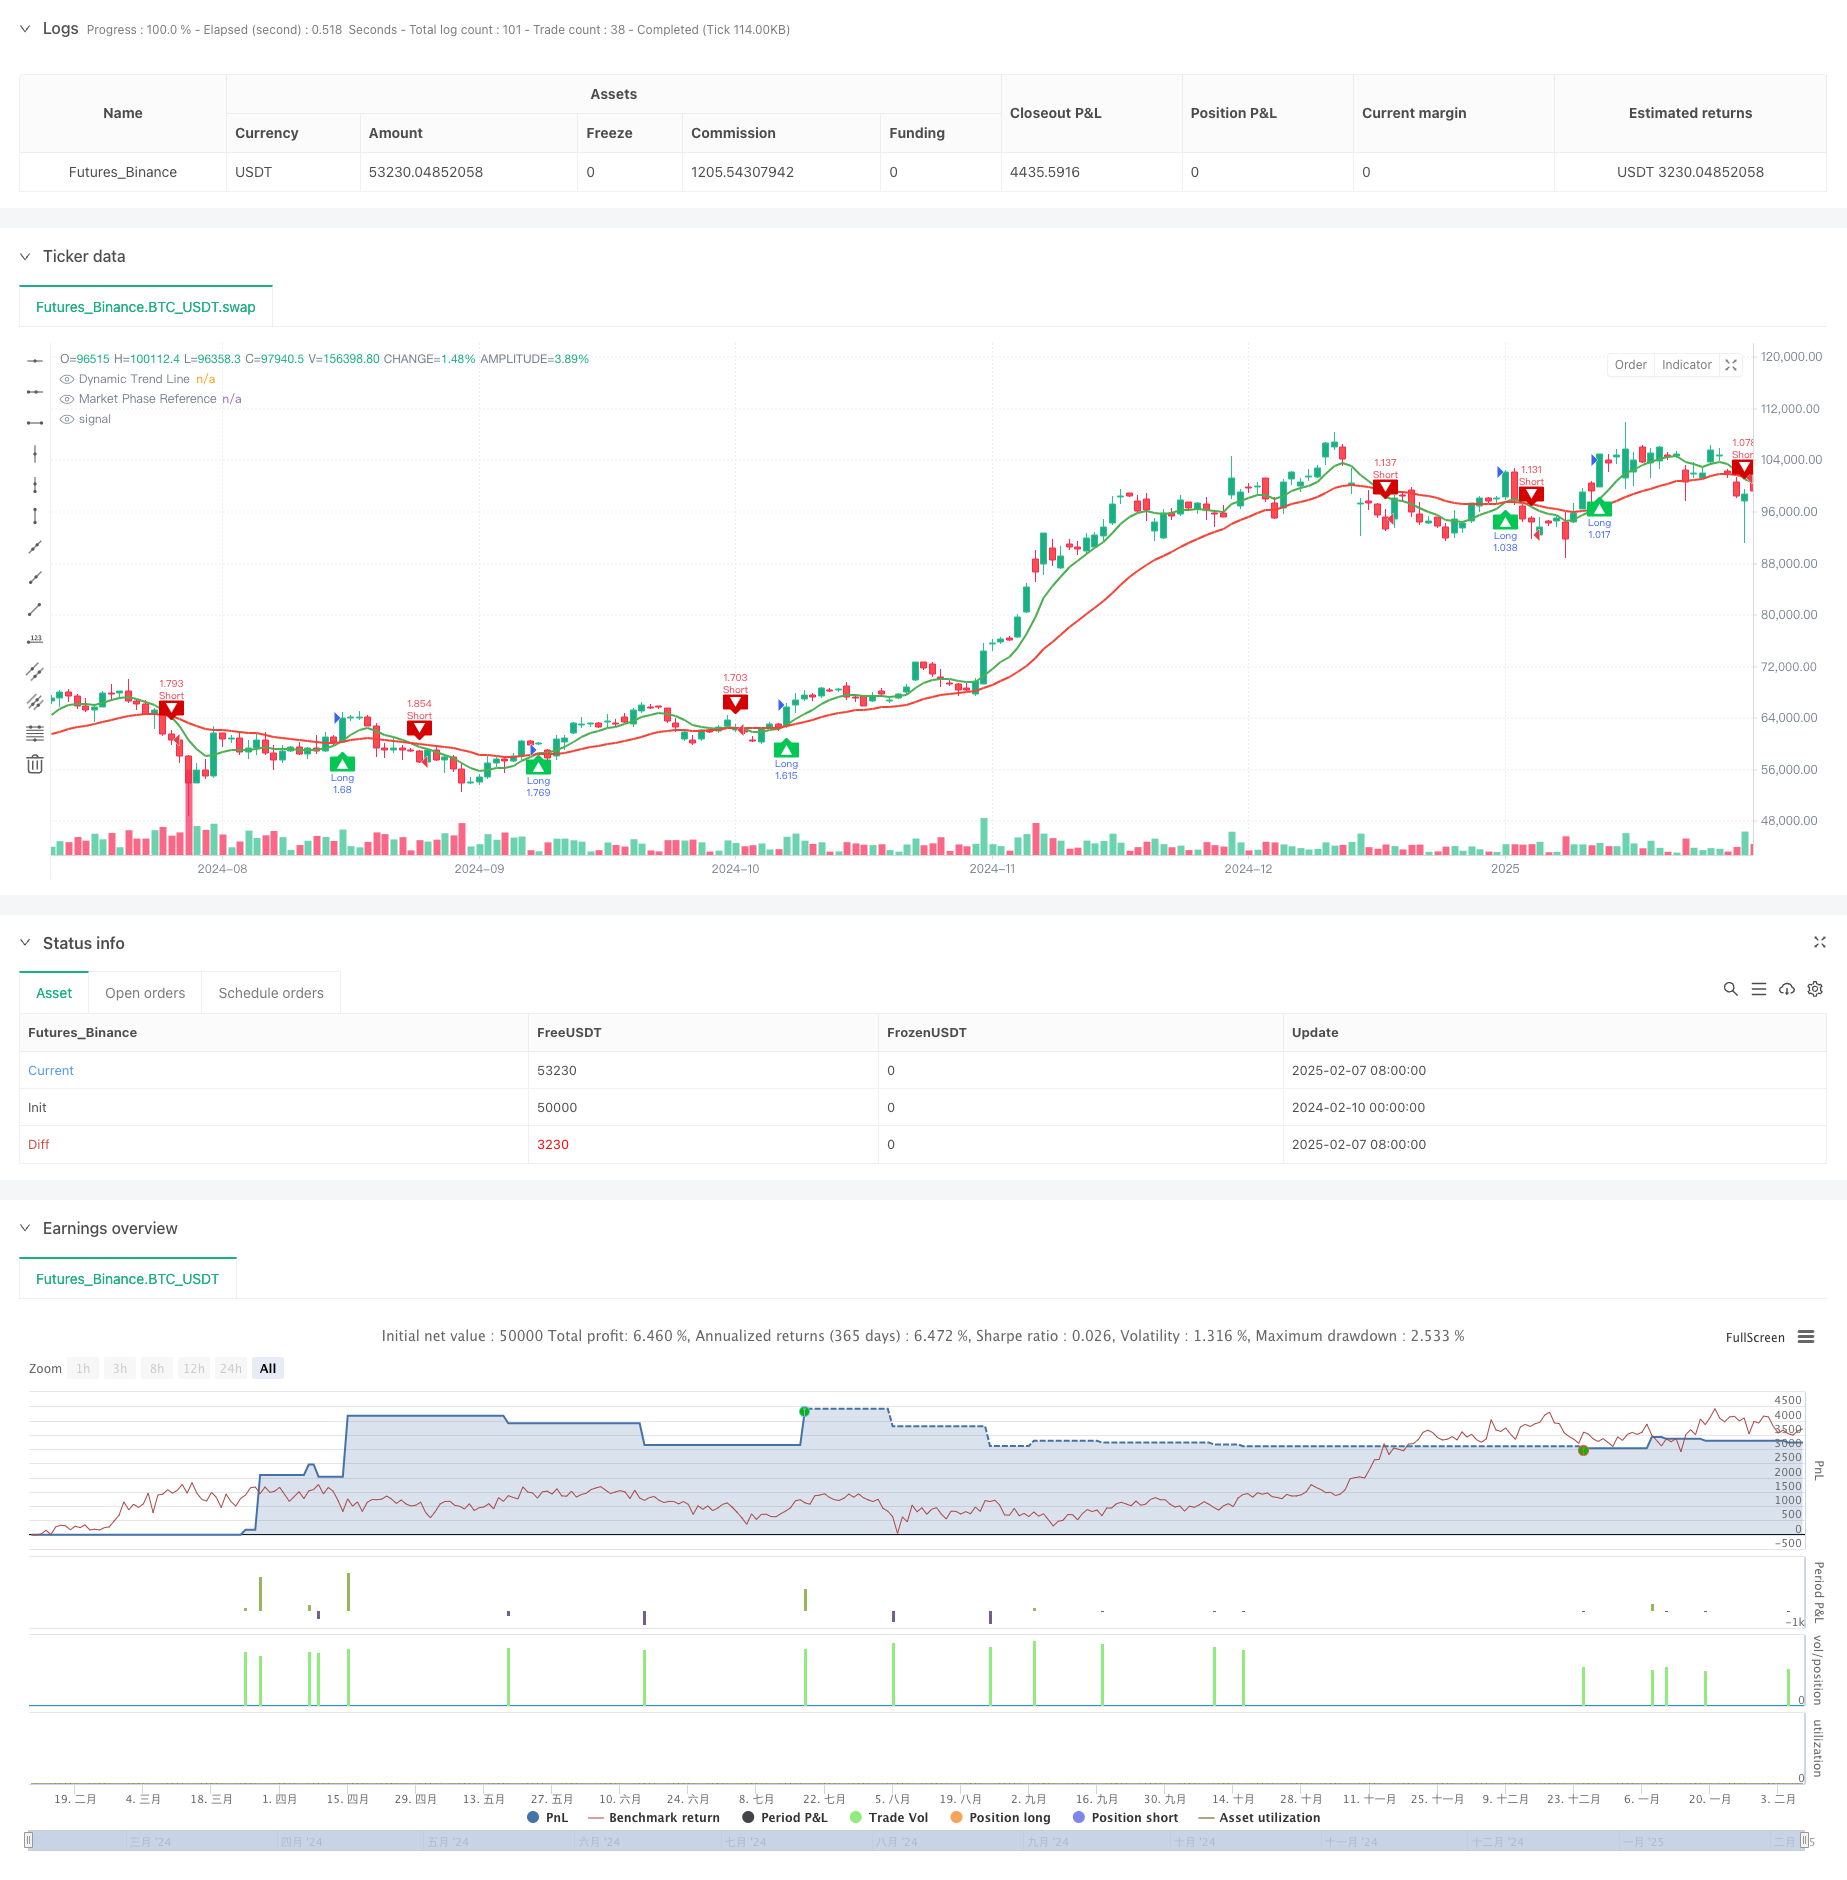
本策略是一个创新的趋势跟踪交易系统,采用了双层指数平滑技术来识别市场趋势。该系统通过对价格数据进行特殊的指数平滑处理,生成两条趋势线,用于捕捉市场的短期和长期走势。系统集成了完整的风险管理模块,包括止盈止损设置,以及灵活的仓位管理功能。
策略原理
策略的核心是其独特的双层指数平滑算法。首先,系统对收盘价进行加权处理,计算方法为(最高价+最低价+2*收盘价)/4,这样可以减少市场噪音的影响。然后通过自定义的指数平滑函数,分别计算9周期和30周期的平滑曲线。当短期曲线穿越长期曲线时,系统会产生交易信号。上穿生成做多信号,下穿生成做空信号。系统还包含了基于百分比的仓位管理系统,默认使用账户100%的资金进行交易。
策略优势
- 信号生成机制清晰,采用经典的趋势跟踪理念,易于理解和执行。
- 双层指数平滑技术能有效过滤市场噪音,提高信号质量。
- 集成了完整的风险管理体系,包括止盈止损和仓位管理。
- 系统可以自适应不同的市场环境,适用于多种交易品种。
- 提供了清晰的视觉指示器,方便交易者快速判断市场方向。
策略风险
- 在震荡市场中可能产生频繁的假信号,导致连续止损。
- 默认使用100%资金进行交易,杠杆率过高可能带来较大风险。
- 固定点数的止盈止损设置可能不适合所有市场环境。
- 系统可能在剧烈波动的市场中出现滑点,影响执行效果。
- 历史回测结果不能保证未来表现。
策略优化方向
- 引入波动率指标(如ATR)来动态调整止盈止损点位。
- 增加趋势强度过滤器,在弱趋势环境下降低交易频率。
- 加入市场环境识别模块,在震荡市场中自动调整策略参数。
- 开发动态仓位管理系统,根据市场情况自动调整交易规模。
- 集成基本面分析模块,提高交易决策的准确性。
总结
这是一个设计合理、逻辑清晰的趋势跟踪系统。通过双层指数平滑技术和完整的风险管理体系,该策略能够在趋势市场中取得良好表现。但是,使用者需要根据自己的风险承受能力调整仓位大小,并且建议在实盘交易前进行充分的回测验证。通过建议的优化方向,该策略还有进一步提升的空间。
策略源码
/*backtest
start: 2024-02-10 00:00:00
end: 2025-02-08 08:00:00
period: 1d
basePeriod: 1d
exchanges: [{"eid":"Futures_Binance","currency":"BTC_USDT"}]
*/

//@version=5
strategy("Dynamic Trend Navigator AI [CodingView]", overlay=true, initial_capital=100000, default_qty_type=strategy.percent_of_equity , default_qty_value=200 )


// ==================================================================================================
// This source code is subject to the terms of the Mozilla Public License 2.0 at https://mozilla.org/MPL/2.0/
// © CodingView_23
//
// Script Name: Dynamic Trend Navigator
// Developed by: theCodingView Team
// Contact: [email protected]
// Website: www.theCodingView.com
//
// Description: Implements an adaptive trend-following strategy using proprietary smoothing algorithms.
// Features include:
// - Dual timeframe trend analysis
// - Custom exponential smoothing technique
// - Integrated risk management (profit targets & stop-loss)
// - Visual trend direction indicators
// ==================================================================================================


// ====== Enhanced Input Configuration ======
primaryLookbackWindow = input.int(9, "Primary Trend Window", minval=2)
secondaryLookbackWindow = input.int(30, "Secondary Trend Window", minval=5)

// ====== Custom Exponential Smoothing Implementation ======
customSmoothingFactor(periods) =>
    smoothingWeight = 2.0 / (periods + 1)
    smoothingWeight

adaptivePricePosition(priceSource, lookback) =>
    weightedSum = 0.0
    smoothingCoefficient = customSmoothingFactor(lookback)
    cumulativeWeight = 0.0
    for iteration = 0 to lookback - 1 by 1
        historicalWeight = math.pow(1 - smoothingCoefficient, iteration)
        weightedSum := weightedSum + priceSource[iteration] * historicalWeight
        cumulativeWeight := cumulativeWeight + historicalWeight
    weightedSum / cumulativeWeight

// ====== Price Transformation Pipeline ======
modifiedClose = (high + low + close * 2) / 4
smoothedSeries1 = adaptivePricePosition(modifiedClose, primaryLookbackWindow)
smoothedSeries2 = adaptivePricePosition(modifiedClose, secondaryLookbackWindow)

// ====== Signal Detection System ======
trendDirectionUp = smoothedSeries1 > smoothedSeries2 and smoothedSeries1[1] <= smoothedSeries2[1]
trendDirectionDown = smoothedSeries1 < smoothedSeries2 and smoothedSeries1[1] >= smoothedSeries2[1]

// ====== Visual Representation Module ======
plot(smoothedSeries1, "Dynamic Trend Line", #4CAF50, 2)
plot(smoothedSeries2, "Market Phase Reference", #F44336, 2)

// ====== Risk Management Configuration ======
enableRiskParameters = input.bool(true, "Activate Risk Controls")
profitTargetUnits = input.float(30, "Profit Target Points")
lossLimitUnits = input.float(30, "Stop-Loss Points")

// ====== Position Management Logic ======
var float entryPrice = na
var float profitTarget = na
var float stopLoss = na

// ====== Long Position Logic ======
if trendDirectionUp
    strategy.close("Short", comment="Short Close")
    strategy.entry("Long", strategy.long)
    entryPrice := close
    profitTarget := close + profitTargetUnits
    stopLoss := close - lossLimitUnits

if enableRiskParameters
    strategy.exit("Long Exit", "Long", limit=profitTarget, stop=stopLoss)

// ====== Short Position Logic ======
if trendDirectionDown
    strategy.close("Long", comment="Long Close")
    strategy.entry("Short", strategy.short)
    entryPrice := close
    profitTarget := close - profitTargetUnits
    stopLoss := close + lossLimitUnits

if enableRiskParameters
    strategy.exit("Short Exit", "Short", limit=profitTarget, stop=stopLoss)

// ====== Visual Signals ======
plotshape(trendDirectionUp, "Bullish", shape.labelup, location.belowbar, #00C853, text="▲", textcolor=color.white)
plotshape(trendDirectionDown, "Bearish", shape.labeldown, location.abovebar, #D50000, text="▼", textcolor=color.white)

// ====== Branding Module ======
var brandingTable = table.new(position.bottom_right, 1, 1)
if barstate.islast
    table.cell(brandingTable, 0, 0, "Trading System v2.0", text_color=color.new(#607D8B, 50))
相关推荐