
Overview
This strategy is a sophisticated quantitative trading system that combines multiple technical indicators, integrating trend following and momentum analysis. The strategy incorporates various indicators including Volume Weighted Average Price (VWAP), Exponential Moving Average (EMA), Relative Strength Index (RSI), and others to create a comprehensive trading decision framework. It focuses on trend confirmation and momentum persistence while implementing strict risk control measures.
Strategy Principles
The strategy employs a multi-layer filtering mechanism to confirm trading signals. Buy signals are generated when price is above both VWAP and EMA20, and SuperTrend indicates an uptrend. It uses RSI for momentum confirmation and Bollinger Bands to identify volatility expansion. The strategy also integrates MACD for trend continuation confirmation and ADX to measure trend strength. Stop-loss is set at 1.5 times ATR, with profit targets at 1.5 times the stop-loss distance.
Strategy Advantages
- Multi-dimensional Analysis: Provides a more comprehensive market perspective by integrating multiple technical indicators
- Robust Risk Control: Uses ATR for dynamic stop-loss adjustment, better adapting to market volatility
- Reliable Trend Confirmation: Employs multiple indicator cross-validation to significantly reduce false breakouts
- Strong Adaptability: Stop-loss and profit targets automatically adjust based on market volatility
- Rigorous Strategy Logic: Entry conditions undergo multiple filters, reducing the probability of false signals
Strategy Risks
- Signal Lag: Multiple confirmation mechanisms may lead to slightly delayed entries
- Poor Performance in Ranging Markets: May generate frequent false signals in sideways markets
- Parameter Optimization Risk: Multiple indicators may lead to over-optimization
- High Execution Costs: Frequent trading may result in significant transaction costs
- Market Environment Dependency: Strategy performance may vary significantly across different market cycles
Strategy Optimization Directions
- Implement Volatility Filtering: Reduce trading frequency in low volatility environments
- Optimize Indicator Weights: Dynamically adjust the importance of different indicators based on market conditions
- Incorporate Volume Analysis: Strengthen signal reliability by integrating volume changes
- Develop Smart Stop-Loss: Dynamically adjust stop-loss positions based on market structure
- Time Filtering: Increase entry condition stringency during specific time periods
Summary
The strategy constructs a comprehensive trading system through the integrated use of multiple technical indicators. While it has certain inherent lag and parameter optimization risks, the strategy demonstrates good stability and adaptability through strict risk control and multiple signal confirmations. Through continuous optimization and improvement, the strategy shows promise in maintaining stable performance across various market environments.
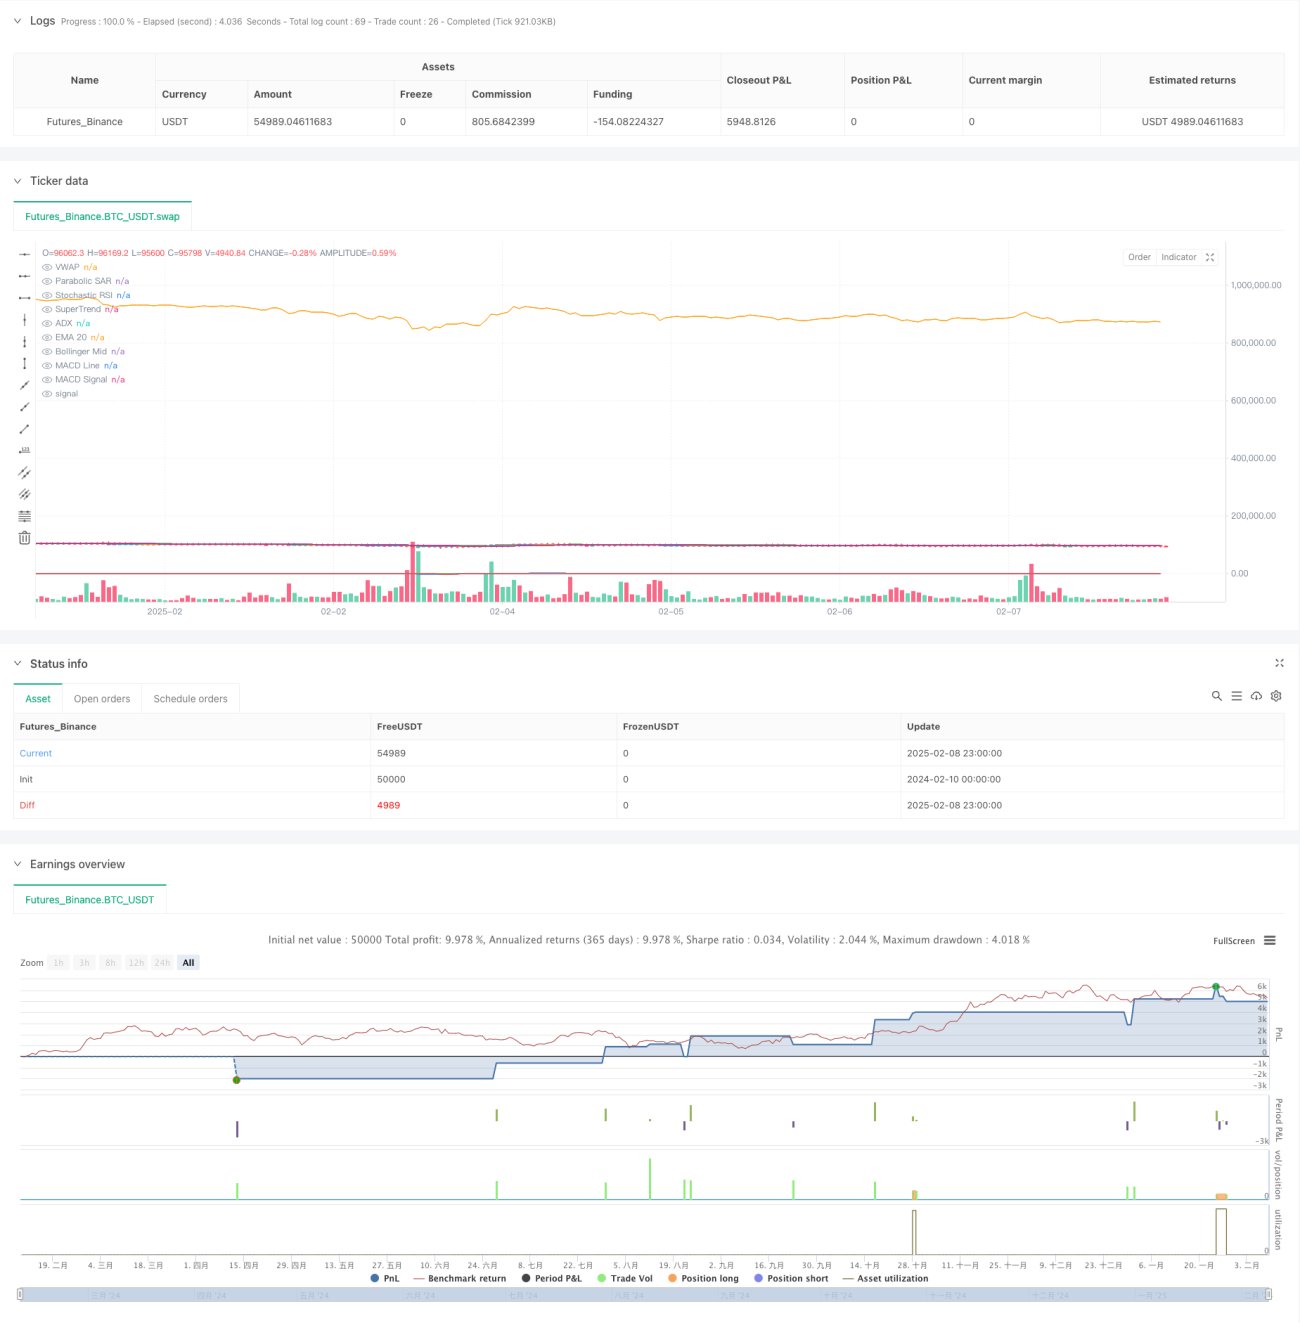
/*backtest
start: 2024-02-10 00:00:00
end: 2025-02-09 00:00:00
period: 1h
basePeriod: 1h
exchanges: [{"eid":"Futures_Binance","currency":"BTC_USDT"}]
*/

//@version=5
strategy("Nifty 1-Min Advanced Scalping", overlay=true, default_qty_type=strategy.percent_of_equity, default_qty_value=200)

// Indicators- 1