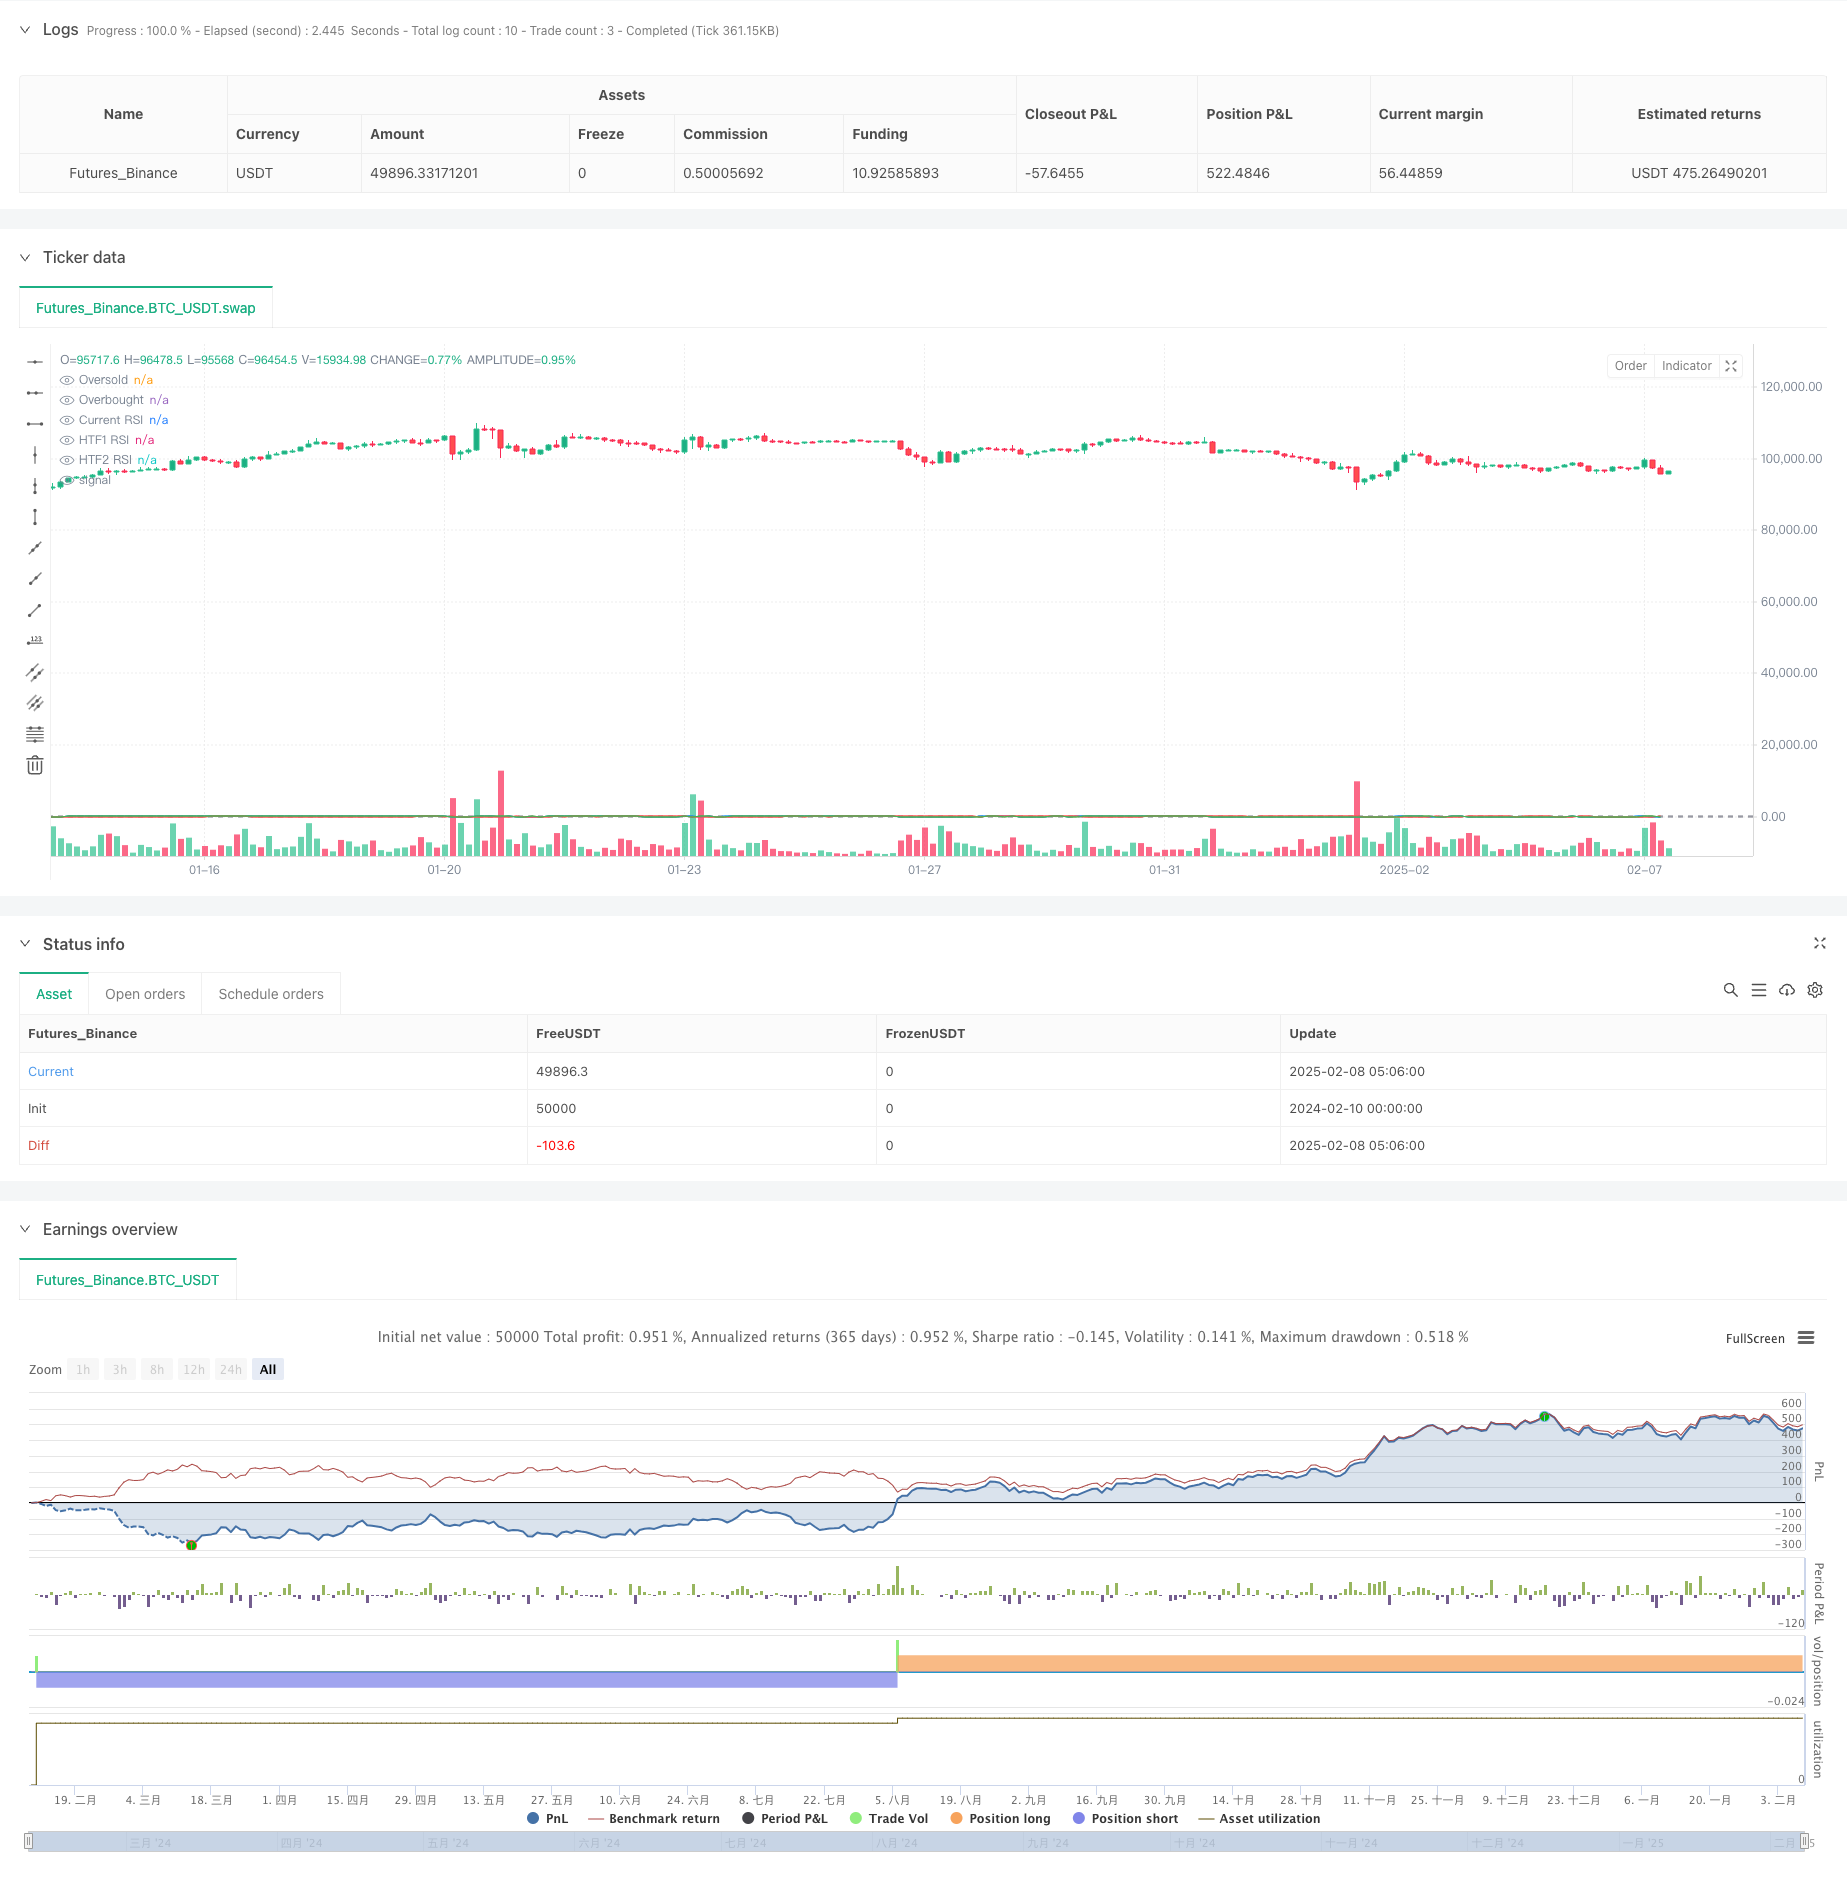
概述
本策略是一个结合了多时间周期RSI指标和动态网格交易系统的复合型策略。它通过分析三个不同时间周期的RSI指标值来识别市场超买超卖状态,并使用基于ATR的动态网格系统来进行仓位管理。策略还包含每日止盈、最大回撤保护等风险控制机制,能够有效地平衡收益和风险。
策略原理
策略的核心逻辑包含以下几个关键部分: 1. 多时间周期分析 - 同时监测当前周期、60分钟和240分钟三个时间周期的RSI指标,只有当三个周期都出现超买或超卖信号时才会触发交易。 2. 动态网格系统 - 使用ATR作为波动率参考,动态计算网格间距。当价格向不利方向移动时,按照设定的乘数因子增加仓位。 3. 仓位管理 - 基于账户权益的1%作为基础仓位,并通过lot_multiplier参数控制网格加仓的幅度。 4. 风险控制 - 包括每日止盈目标、2%账户权益的最大回撤保护,以及反向信号平仓机制。
策略优势
- 多维度信号确认 - 通过分析多个时间周期的RSI指标,有效降低假信号。
- 灵活的仓位管理 - 动态网格系统能够根据市场波动自适应调整网格间距。
- 完善的风险控制 - 每日止盈和最大回撤保护机制有效控制风险。
- 高度可定制 - 提供多个可调参数,便于根据不同市场环境优化策略。
策略风险
- 趋势风险 - 在强趋势市场中,网格策略可能面临持续损失。建议增加趋势过滤器。
- 资金管理风险 - 多重网格可能导致资金使用过度。建议严格控制最大网格层数。
- 参数敏感性 - 策略表现对参数设置较为敏感。建议进行充分的参数优化测试。
策略优化方向
- 趋势识别增强 - 可以添加移动平均线等趋势指标作为过滤器。
- 动态参数调整 - 根据市场波动率自动调整RSI阈值和网格参数。
- 止损优化 - 可以为每个网格位设置独立的止损位。
- 时间过滤 - 添加交易时间过滤,避开低流动性时段。
总结
该策略通过结合多时间周期RSI分析和动态网格交易系统,创造了一个均衡的交易方案。完善的风险控制机制和灵活的参数设置使其适用于不同的市场环境。通过建议的优化方向,策略的稳定性和盈利能力还可以进一步提升。
策略源码
/*backtest
start: 2024-02-10 00:00:00
end: 2025-02-08 08:00:00
period: 3h
basePeriod: 3h
exchanges: [{"eid":"Futures_Binance","currency":"BTC_USDT"}]
*/

//@version=5
strategy("Multi-Timeframe RSI Grid Strategy with Arrows", overlay=true)

// Input parameters
rsi_length = input.int(14, "RSI Length")
oversold = input.int(30, "Oversold Level")
overbought = input.int(70, "Overbought Level")
higher_tf1 = input.string("60", "Higher Timeframe 1")
higher_tf2 = input.string("240", "Higher Timeframe 2")
grid_factor = input.float(1.2, "Grid Multiplication Factor", step=0.1)
lot_multiplier = input.float(1.5, "Lot Multiplication Factor", step=0.1)
max_grid = input.int(5, "Maximum Grid Levels")
daily_target = input.float(4.0, "Daily Profit Target (%)", step=0.5)
atr_length = input.int(14, "ATR Length")

// Calculate RSI values
current_rsi = ta.rsi(close, rsi_length)
higher_tf1_rsi = request.security(syminfo.tickerid, higher_tf1, ta.rsi(close, rsi_length))
higher_tf2_rsi = request.security(syminfo.tickerid, higher_tf2, ta.rsi(close, rsi_length))

// Grid system variables
var int grid_level = 0
var float last_entry_price = na
var float base_size = strategy.equity * 0.01 / close
var float daily_profit_target = strategy.equity * (daily_target / 100)
var bool target_reached = false

// ATR for grid spacing
atr = ta.atr(atr_length)
grid_space = atr * grid_factor

// Daily reset
new_day = ta.change(time("D"))
if new_day
    daily_profit_target := strategy.equity * (daily_target / 100)
    target_reached := false
    grid_level := 0
    last_entry_price := na

// Trading conditions
buy_condition = current_rsi < oversold and higher_tf1_rsi < oversold and higher_tf2_rsi < oversold
sell_condition = current_rsi > overbought and higher_tf1_rsi > overbought and higher_tf2_rsi > overbought

// Reverse signal detection
reverse_long_to_short = sell_condition and strategy.position_size > 0
reverse_short_to_long = buy_condition and strategy.position_size < 0

// Close all trades on reverse signals
if reverse_long_to_short or reverse_short_to_long
    strategy.close_all()
    grid_level := 0
    last_entry_price := na

// Grid management logic
if strategy.position_size == 0
    grid_level := 0
    last_entry_price := na

if strategy.position_size > 0 and not reverse_long_to_short
    if close < last_entry_price - grid_space and grid_level < max_grid and not target_reached
        strategy.entry("Long Grid " + str.tostring(grid_level), strategy.long, qty=base_size * math.pow(lot_multiplier, grid_level))
        grid_level += 1
        last_entry_price := close

if strategy.position_size < 0 and not reverse_short_to_long
    if close > last_entry_price + grid_space and grid_level < max_grid and not target_reached
        strategy.entry("Short Grid " + str.tostring(grid_level), strategy.short, qty=base_size * math.pow(lot_multiplier, grid_level))
        grid_level += 1
        last_entry_price := close

// Initial entry
if buy_condition and strategy.position_size == 0 and not target_reached
    strategy.entry("Long", strategy.long, qty=base_size)
    grid_level := 1
    last_entry_price := close

if sell_condition and strategy.position_size == 0 and not target_reached
    strategy.entry("Short", strategy.short, qty=base_size)
    grid_level := 1
    last_entry_price := close

// Profit target check
current_profit = strategy.netprofit + strategy.openprofit
if current_profit >= daily_profit_target and not target_reached
    strategy.close_all()
    target_reached := true

// Drawdown protection
if strategy.openprofit < -(0.02 * strategy.equity)  // 2% drawdown protection
    strategy.close_all()
    grid_level := 0
    last_entry_price := na

// Plot Buy and Sell Arrows
plotshape(series=buy_condition and strategy.position_size == 0, title="Buy Signal", location=location.belowbar, color=color.green, style=shape.labelup, text="BUY", size=size.small)
plotshape(series=sell_condition and strategy.position_size == 0, title="Sell Signal", location=location.abovebar, color=color.red, style=shape.labeldown, text="SELL", size=size.small)

// Plotting RSI
plot(current_rsi, "Current RSI", color=color.blue)
plot(higher_tf1_rsi, "HTF1 RSI", color=color.red)
plot(higher_tf2_rsi, "HTF2 RSI", color=color.green)
hline(oversold, "Oversold", color=color.gray)
hline(overbought, "Overbought", color=color.gray)
相关推荐