
Based on the provided code, I'll help create an SEO-friendly article analyzing this trading strategy in both Chinese and English.
Overview
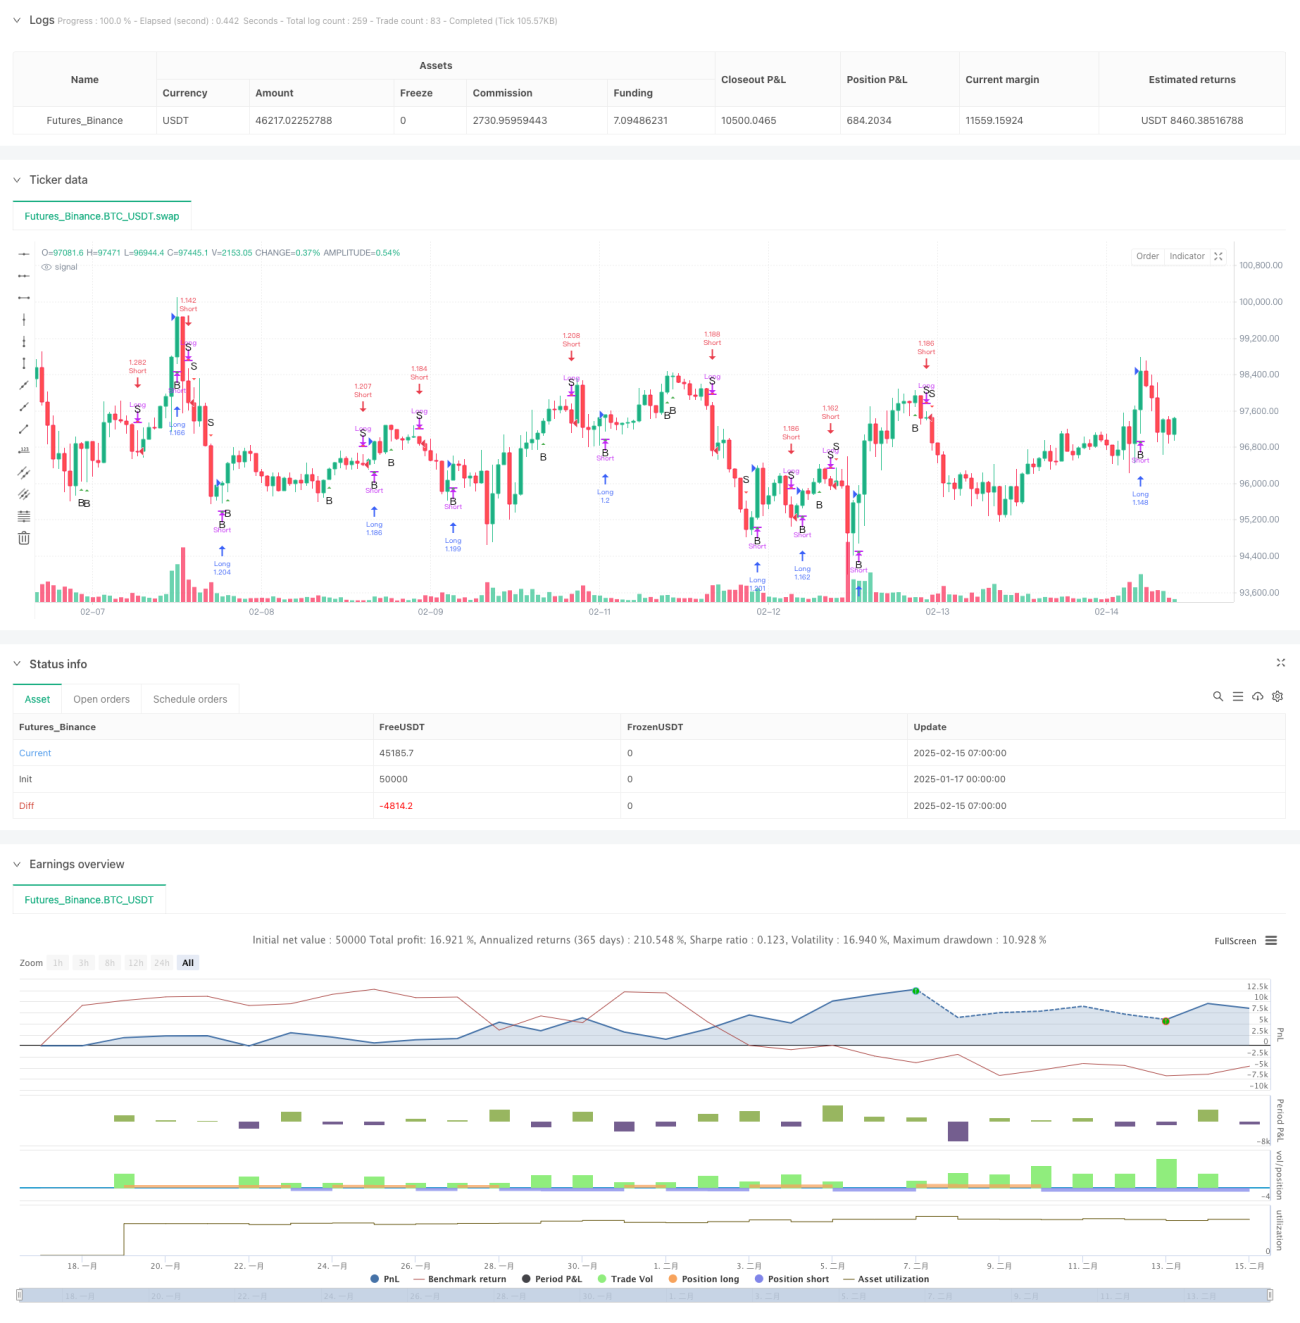
This strategy is based on Price Action analysis and Bill Williams' bar thirds theory. It analyzes the position relationships of opening and closing prices within the three equal sections of current and previous bars to identify market trend reversal points and continuity, generating trading signals. The strategy relies solely on price action without any technical indicators, eliminating emotional bias through a systematic approach.
Strategy Principle
The core logic divides each bar's range into three equal parts and analyzes the position of opening and closing prices within these sections to determine market trends. Specifically:
- Bar Classification - Categorizes bars based on open/close positions:
- Bullish Patterns: 1-3(low open high close), 2-3(mid open high close), 3-3(high open high close)
- Bearish Patterns: 3-1(high open low close), 2-1(mid open low close), 1-1(low open low close)
- Signal Generation - Confirms trading signals through two consecutive bars:
- Buy Signal: Previous bar shows any bullish pattern, current bar is 1-3 or 3-3
- Sell Signal: Previous bar shows any bearish pattern, current bar is 1-1 or 3-1
- Trade Execution - Automatically executes market orders:
- On buy signals, closes short positions and opens long
- On sell signals, closes long positions and opens short
Strategy Advantages
- Pure Price-Driven - Based entirely on price action, avoiding indicator lag
- Systematic Trading - Executes trades through clear rules, reducing subjective bias
- Trend Following - Effectively captures significant price movements
- Risk Control - Improves signal reliability through two-bar analysis
- Simple and Intuitive - Clear strategy logic, easy to understand and implement
Strategy Risks
- Unsuitable for Ranging Markets - May generate frequent false signals in sideways markets
- Delayed Entry - Requires bar closure for signal confirmation, potentially missing optimal entry points
- Insufficient Money Management - Strategy lacks built-in stop-loss/profit mechanisms
- Market Environment Dependency - May underperform in low liquidity or high volatility conditions
- Parameter Sensitivity - Bar timeframe selection significantly impacts strategy performance
Strategy Optimization Directions
- Volatility Filtering - Add ATR or similar indicators to dynamically adjust trading frequency
- Enhanced Risk Control - Design dynamic stop-loss/profit mechanisms based on bar thirds
- Improved Signal Confirmation - Consider volume and volatility as auxiliary indicators
- Market Environment Analysis - Develop market state recognition for parameter adaptation
- Position Management Improvement - Dynamically adjust position sizes based on signal strength
Summary
This strategy establishes an effective trend-following system through an innovative bar-thirds approach to price action analysis. While it has limitations, proper optimization and risk control measures can generate stable returns in trending markets. Its core strengths lie in the systematic methodology and deep price action analysis, providing a valuable reference direction for quantitative trading.
- 1