Multi-Indicator Dynamic Trend Prediction Trading System

Overview
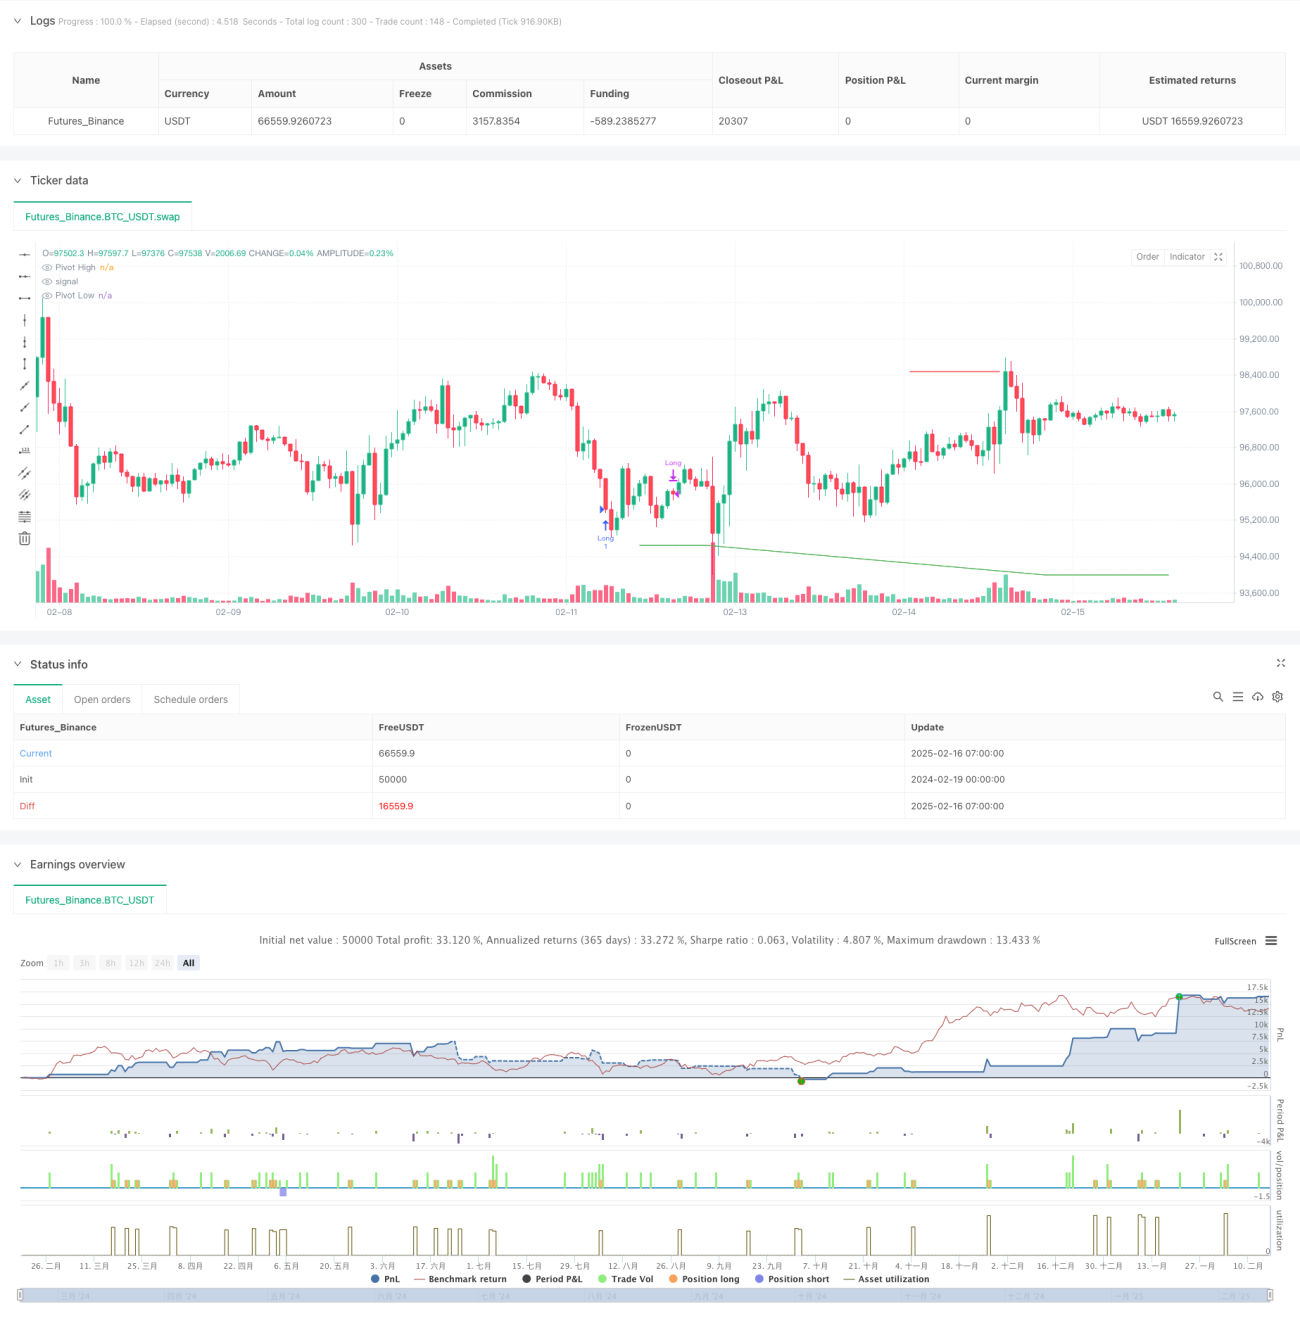
This strategy is an intraday trading system based on multiple technical indicators, combining RSI, Stochastic Oscillator, and Pivot Points for trend prediction and trading decisions. The system analyzes market overbought/oversold conditions through multiple dimensions and integrates price support/resistance levels to accurately capture market turning points.
Strategy Principles
The strategy employs a triple-indicator verification mechanism:
- Uses RSI to monitor price momentum, setting overbought at 70 and oversold at 30 as primary filtering conditions
- Applies Stochastic Oscillator's %K and %D values for trend confirmation, with 80 and 20 as key thresholds
- Incorporates daily Pivot Points to determine support/resistance levels, providing price references for trading
Trade signals require the following conditions to be met simultaneously:
- Long entry: RSI below 30 and Stochastic below 20, with price above pivot support
- Short entry: RSI above 70 and Stochastic above 80, with price below pivot resistance
- Exit conditions: RSI or Stochastic returning to the 50 median level
Strategy Advantages
- Multiple indicator cross-validation reduces false signals
- Integration of different timeframe data provides a more comprehensive market perspective
- Clear risk control thresholds with objective quantified trading rules
- Flexible parameter adjustment capability for market adaptation
- Suitable for both intraday and swing trading
Strategy Risks
- Potential lag during extreme market volatility
- Relatively fewer opportunities when all indicators must align
- Improper parameter settings may miss important trading opportunities
- False signals during sideways market conditions
- Requires continuous monitoring and timely parameter adjustments
Optimization Directions
- Implement adaptive parameter mechanisms based on market volatility
- Add volume analysis dimension to improve signal reliability
- Optimize stop-loss and take-profit mechanisms for better capital efficiency
- Include trend strength filters to reduce false signals during consolidation
- Develop intelligent parameter optimization system for strategy evolution
Summary
This strategy constructs a relatively complete trading decision system through multi-indicator collaborative analysis. The system integrates momentum indicators, volatility indicators, and price level analysis to effectively capture major market turning points. While there are some inherent lag risks, the strategy's stability and reliability can be further improved through continuous optimization and refinement. Traders are advised to conduct thorough backtesting before live implementation and adjust parameters according to specific market characteristics.
- 1