Hybrid EMA Momentum Trading System with Trend Persistence Analysis Strategy

Overview
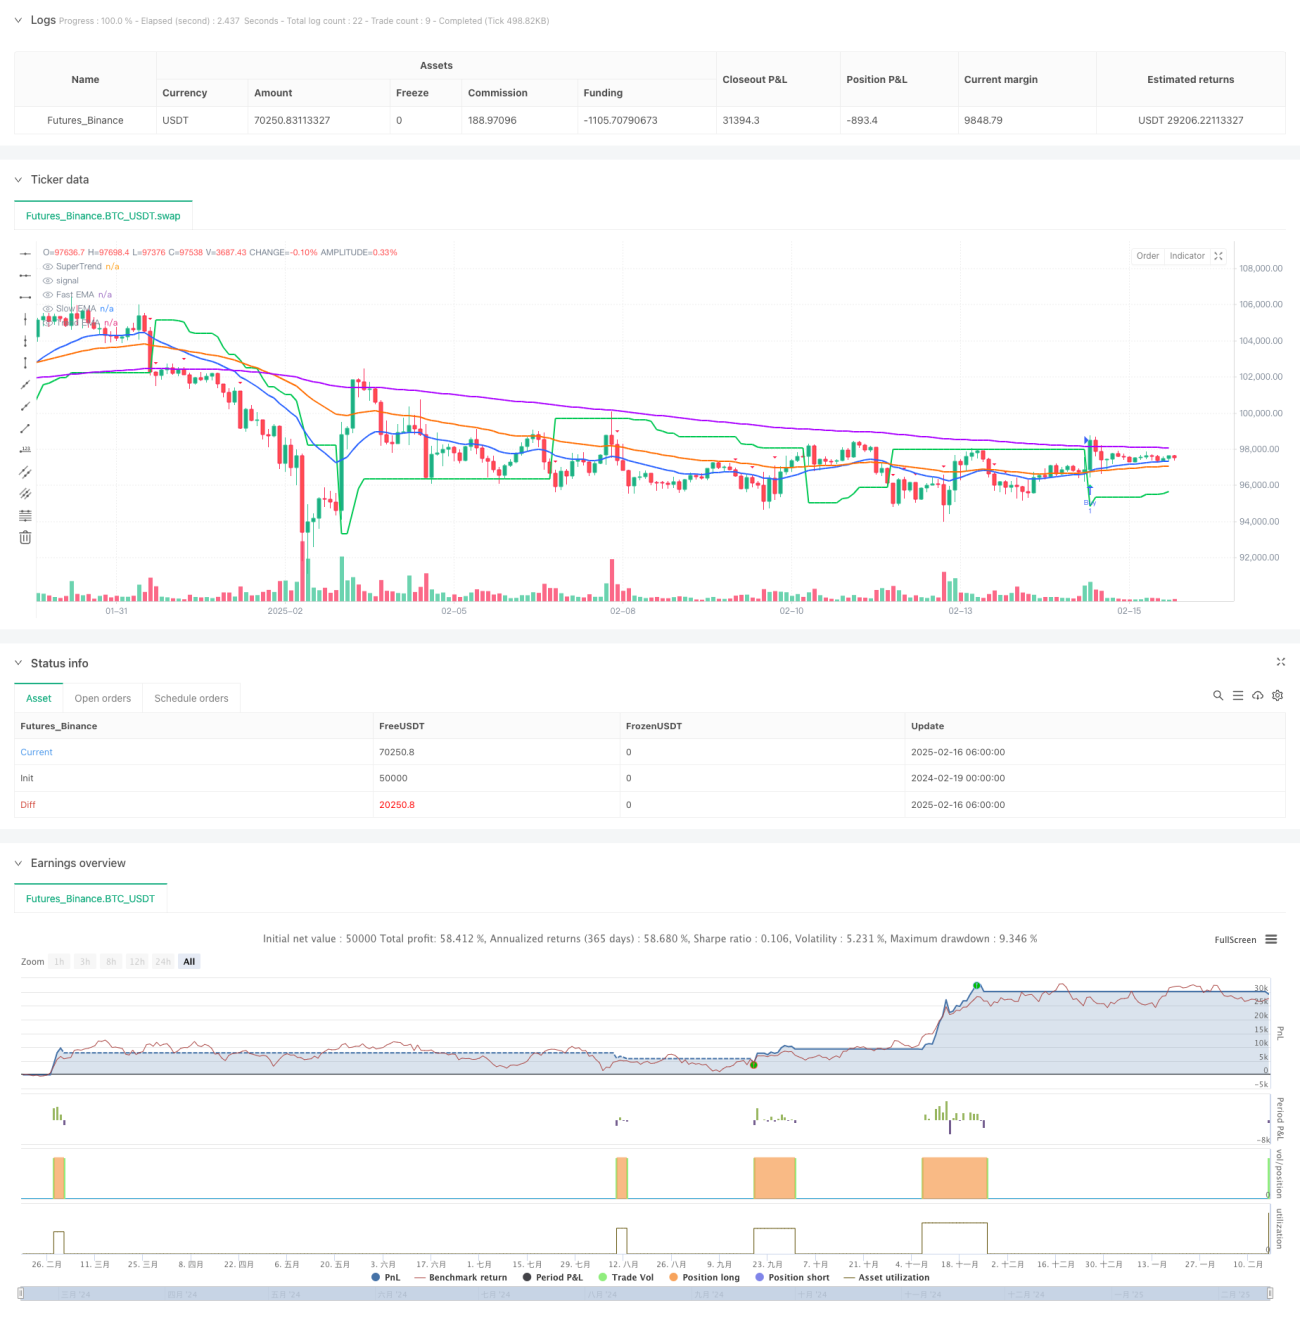
This strategy is a hybrid trading system that combines multiple technical indicators, including Exponential Moving Averages (EMA), Relative Strength Index (RSI), and SuperTrend to capture market trends. The strategy uses fixed parameters optimized for 2-hour timeframes, employing a 21/55/200 EMA system for trend identification, combined with RSI(14) momentum filter and SuperTrend(3,14) stop-loss for risk management. It also requires a 1.5x volume surge and ATR volatility confirmation to enhance trading reliability.
Strategy Principles
The core logic is built on a multi-layered technical analysis framework:
- Trend identification system uses triple EMAs (21/55/200 periods) to determine trend direction through crossovers and relative positions
- Momentum confirmation system employs RSI(14) indicator combined with its EMA to filter false breakouts
- Risk control system integrates SuperTrend indicator as dynamic stop-loss and implements a 6-hour trade cooldown period
- Trade trigger conditions require volume exceeding 1.5x of 20-period average volume and ATR above its 48-period EMA
Strategy Advantages
- Parameter Optimization: Uses pre-optimized fixed parameters requiring no frequent adjustments
- Trend Capture: Effectively captures persistent trends through multiple technical indicator coordination
- Risk Control: Built-in trade cooldown mechanism prevents overtrading
- Market Adaptability: Performs well in highly volatile markets
- Trade Confirmation: Multiple condition filters enhance trading signal reliability
Strategy Risks
- Gap Risk: Potential losses from gaps in 24-hour trading markets
- News Impact: Major news events may cause severe price volatility affecting strategy performance
- Stop-Loss Rigidity: Fixed stop-loss settings may lack flexibility
- Market Environment Dependence: May generate frequent false signals in ranging markets
- Slippage Risk: Potential significant slippage in markets with poor liquidity
Strategy Optimization Directions
- Dynamic Parameter Adjustment: Implement automatic SuperTrend parameter adjustment based on market volatility
- Market Environment Recognition: Add market state identification module for different parameter settings in various market conditions
- Stop-Loss Optimization: Introduce dynamic stop-loss mechanism adapting to market volatility
- Volume Analysis Enhancement: Incorporate more sophisticated volume analysis models to improve signal accuracy
- Risk Management Optimization: Implement dynamic position sizing system based on market conditions
Summary
This strategy constructs a relatively complete trading system through the combination of multiple technical indicators. Its strength lies in effective trend capture and enhanced trading reliability through multiple condition filters. While inherent risks exist, the strategy's overall performance can be improved through optimization and refinement. It is particularly suitable for volatile markets but requires attention to market environment changes and risk control.
- 1