Multi-Indicator Cross-Adaptive Trend Following Trading Strategy

Overview
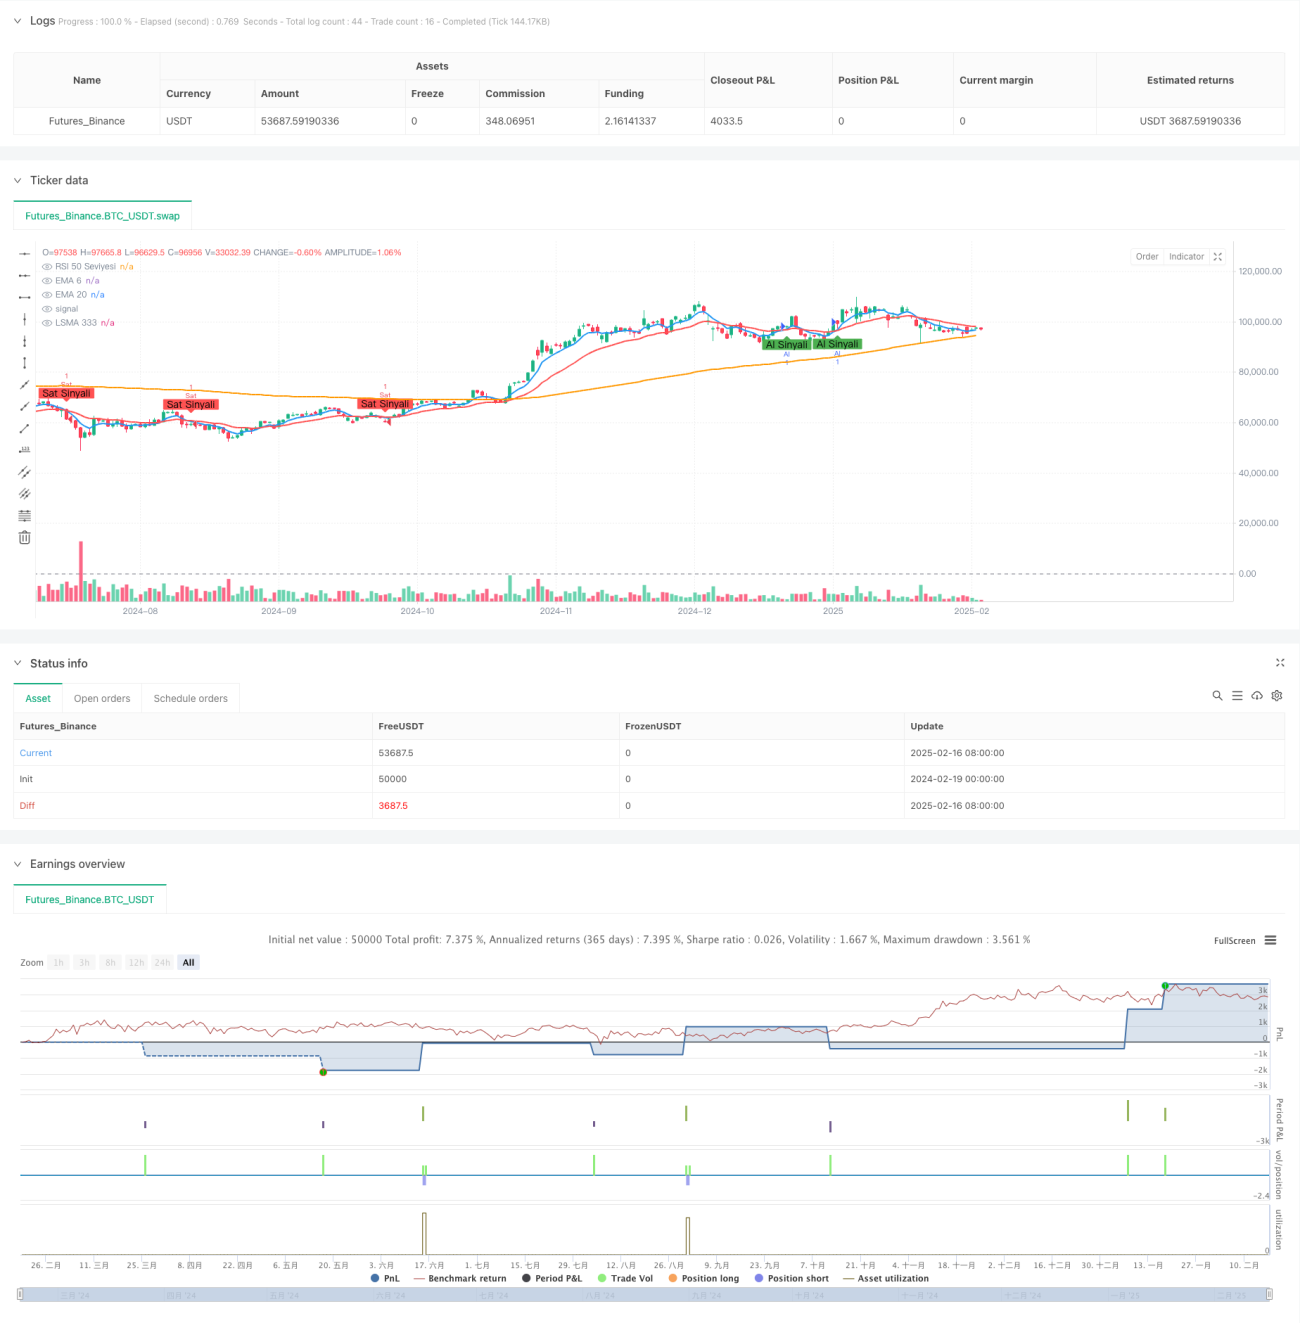
This strategy is a trend-following system based on multiple technical indicator crossovers, combining EMA (Exponential Moving Average), LSMA (Least Squares Moving Average), and RSI (Relative Strength Index). It filters trading opportunities through multiple signal confirmations and employs an adaptive stop-loss/take-profit mechanism that can dynamically adjust risk management parameters based on market volatility.
Strategy Principles
The core logic includes:
- Using short-period (6) and long-period (20) EMAs to capture trend reversal points
- Employing LSMA(333) as a long-term trend confirmation indicator
- Using RSI(14)'s 50 level as a market strength/weakness threshold
- Opening long positions when all conditions are met:
- EMA6 crosses above EMA20
- Price is above LSMA333
- RSI is above 50
- Opening short positions when all conditions are met:
- EMA6 crosses below EMA20
- Price is below LSMA333
- RSI is below 50
Strategy Advantages
- Multiple indicator crossover confirmations significantly reduce false signals
- Combines trend-following and momentum indicators for improved signal reliability
- Implements adaptive stop-loss/take-profit mechanisms that adjust to market conditions
- Clear strategy logic with adjustable parameters
- Enhanced win rate through multi-dimensional market analysis
Strategy Risks
- May generate frequent false signals in ranging markets
- Multiple indicator confirmation may lead to slightly delayed entries
- Fixed percentage stop-loss/take-profit may not suit all market conditions
- Risk of overfitting through parameter optimization
- Potential missed opportunities in fast-moving markets
Optimization Directions
- Introduce volatility indicators for dynamic stop-loss/take-profit ratio adjustment
- Add volume analysis for trend validity confirmation
- Consider implementing market condition classification for parameter adaptation
- Optimize indicator parameter self-adaptation mechanisms
- Add position management system for more flexible position control
Summary
This strategy constructs a relatively robust trend-following system through the coordinated use of multiple technical indicators. Its core strength lies in signal confirmation reliability, while attention must be paid to adaptability across different market conditions. Through continuous optimization and improvement, the strategy shows promise for enhanced performance in actual trading.
- 1