Multi-Period EMA Trend Detection with RSI Overbought Strategy

Overview
This strategy is a trend-following trading system based on multiple-period Exponential Moving Averages (EMA) and the Relative Strength Index (RSI). It makes trading decisions by analyzing the trends of 20, 50, and 100-period EMAs, combined with price breakouts and RSI overbought signals. The strategy is primarily designed for trending markets, using multiple technical indicators to enhance trading accuracy.
Strategy Principles
The core logic includes the following key components:
- Trend Detection: Comparing current and previous EMA values to determine if all three periods (20/50/100) are in upward trends
- Entry Conditions: Generates a buy signal when price crosses above the 20-period EMA and all EMAs are trending upward
- Exit Conditions: Closes positions when RSI exceeds 70 (overbought) or price falls below the 20-period EMA
- Position Management: Uses a percentage (10%) of account equity for position sizing
Strategy Advantages
- Multiple Confirmation Mechanism: Reduces false breakout risks through validation of three different EMA periods and RSI
- Trend Following: Effectively captures medium to long-term trends, enhancing profit potential
- Risk Control: Uses RSI overbought signals and EMA crossunders as stop-loss conditions
- Money Management: Implements percentage-based position sizing that scales with account size
- Systematic Operation: Clear rules minimize subjective judgment interference
Strategy Risks
- Lag Effect: EMAs as lagging indicators may cause delayed entries and exits
- Sideways Market Risk: May generate frequent false signals in ranging markets
- Gap Risk: Large market gaps may render stop-loss levels ineffective
- Parameter Sensitivity: EMA periods and RSI thresholds may need adjustment in different market conditions
- Transaction Costs: Frequent trading may incur significant costs
Strategy Optimization Directions
- Market Environment Recognition: Add market state identification to reduce position size or pause trading in ranging markets
- Dynamic Parameter Optimization: Automatically adjust EMA periods and RSI thresholds based on market volatility
- Stop-Loss Enhancement: Implement trailing stop-loss mechanisms to better protect profits
- Entry Refinement: Add volume confirmation to improve breakout signal reliability
- Position Sizing Enhancement: Dynamically adjust position size based on trend strength and market volatility
Summary
This is a composite strategy system combining trend following and momentum reversal. Through the coordinated use of multiple technical indicators, it achieves a favorable risk-reward profile while maintaining simplicity. The strategy's core strengths lie in its strict trend confirmation mechanism and comprehensive risk control system, though practical application requires attention to parameter optimization and market environment adaptability. Through the suggested optimization directions, there is room for further strategy enhancement.
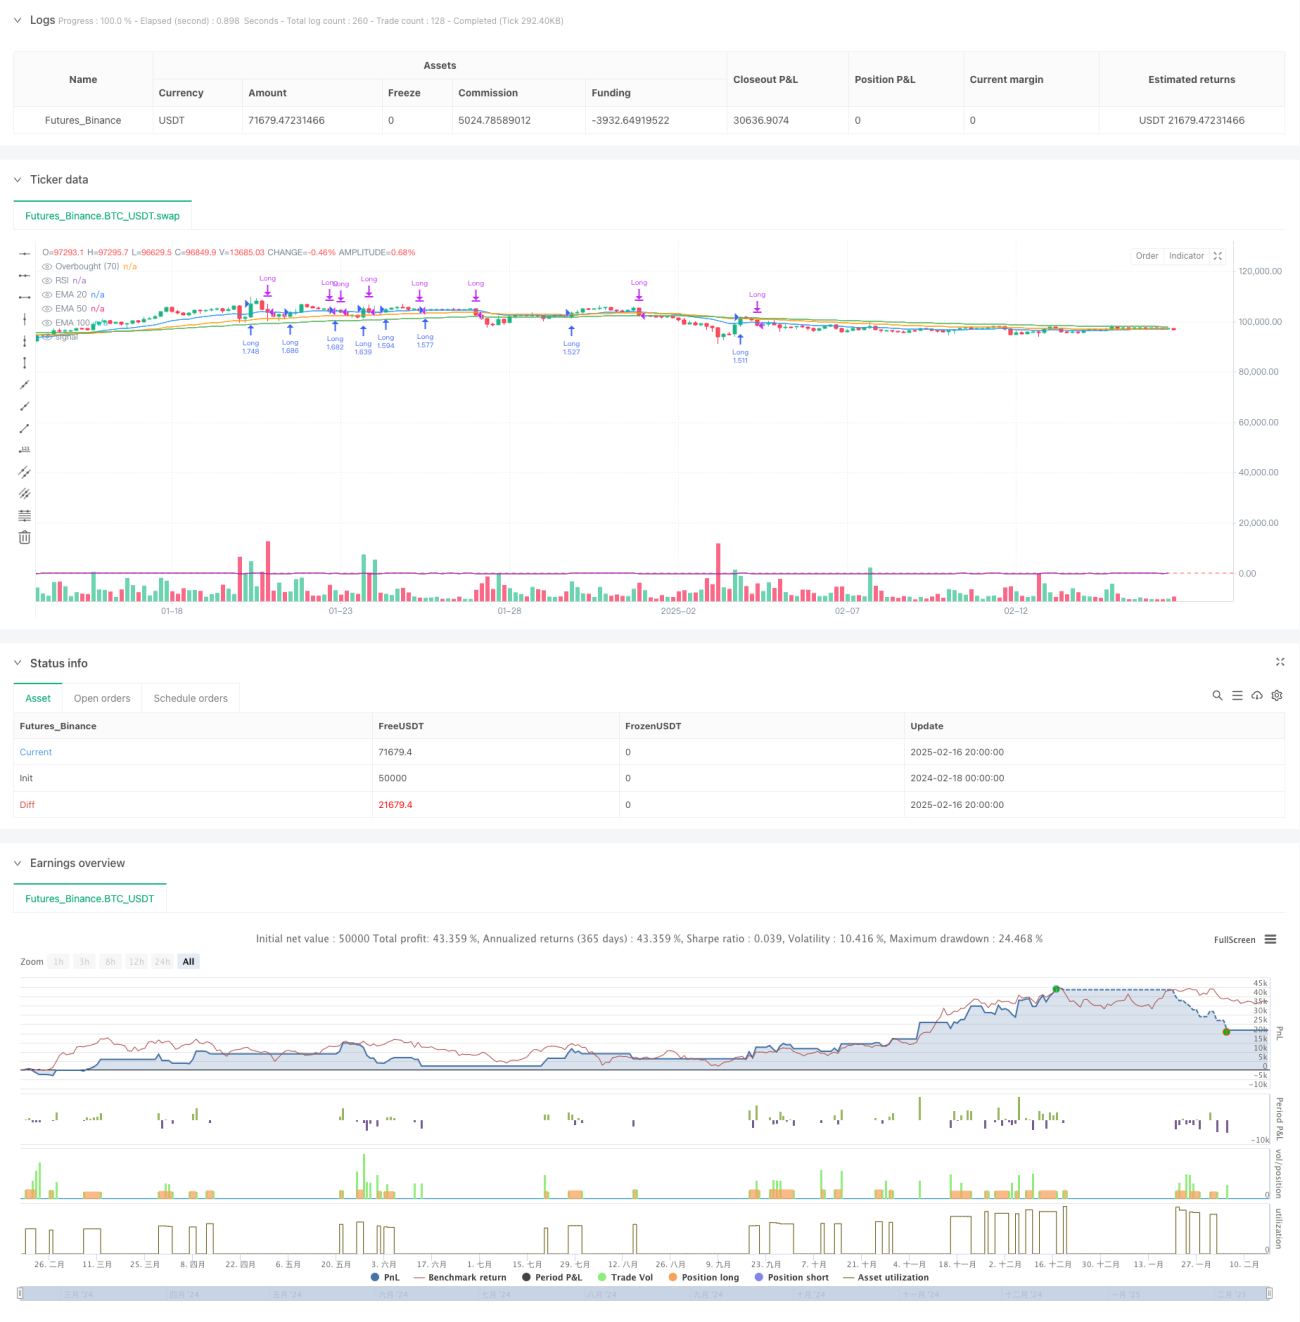
/*backtest
start: 2024-02-18 00:00:00
end: 2025-02-17 00:00:00
period: 4h
basePeriod: 4h
exchanges: [{"eid":"Futures_Binance","currency":"BTC_USDT"}]
*/

//@version=5
strategy("EMA Crossover + RSI Strategy", overlay=true, initial_capital=10000, default_qty_type=strategy.percent_of_equity, default_qty_value=200)

// Calculate EMAs- 1