概述
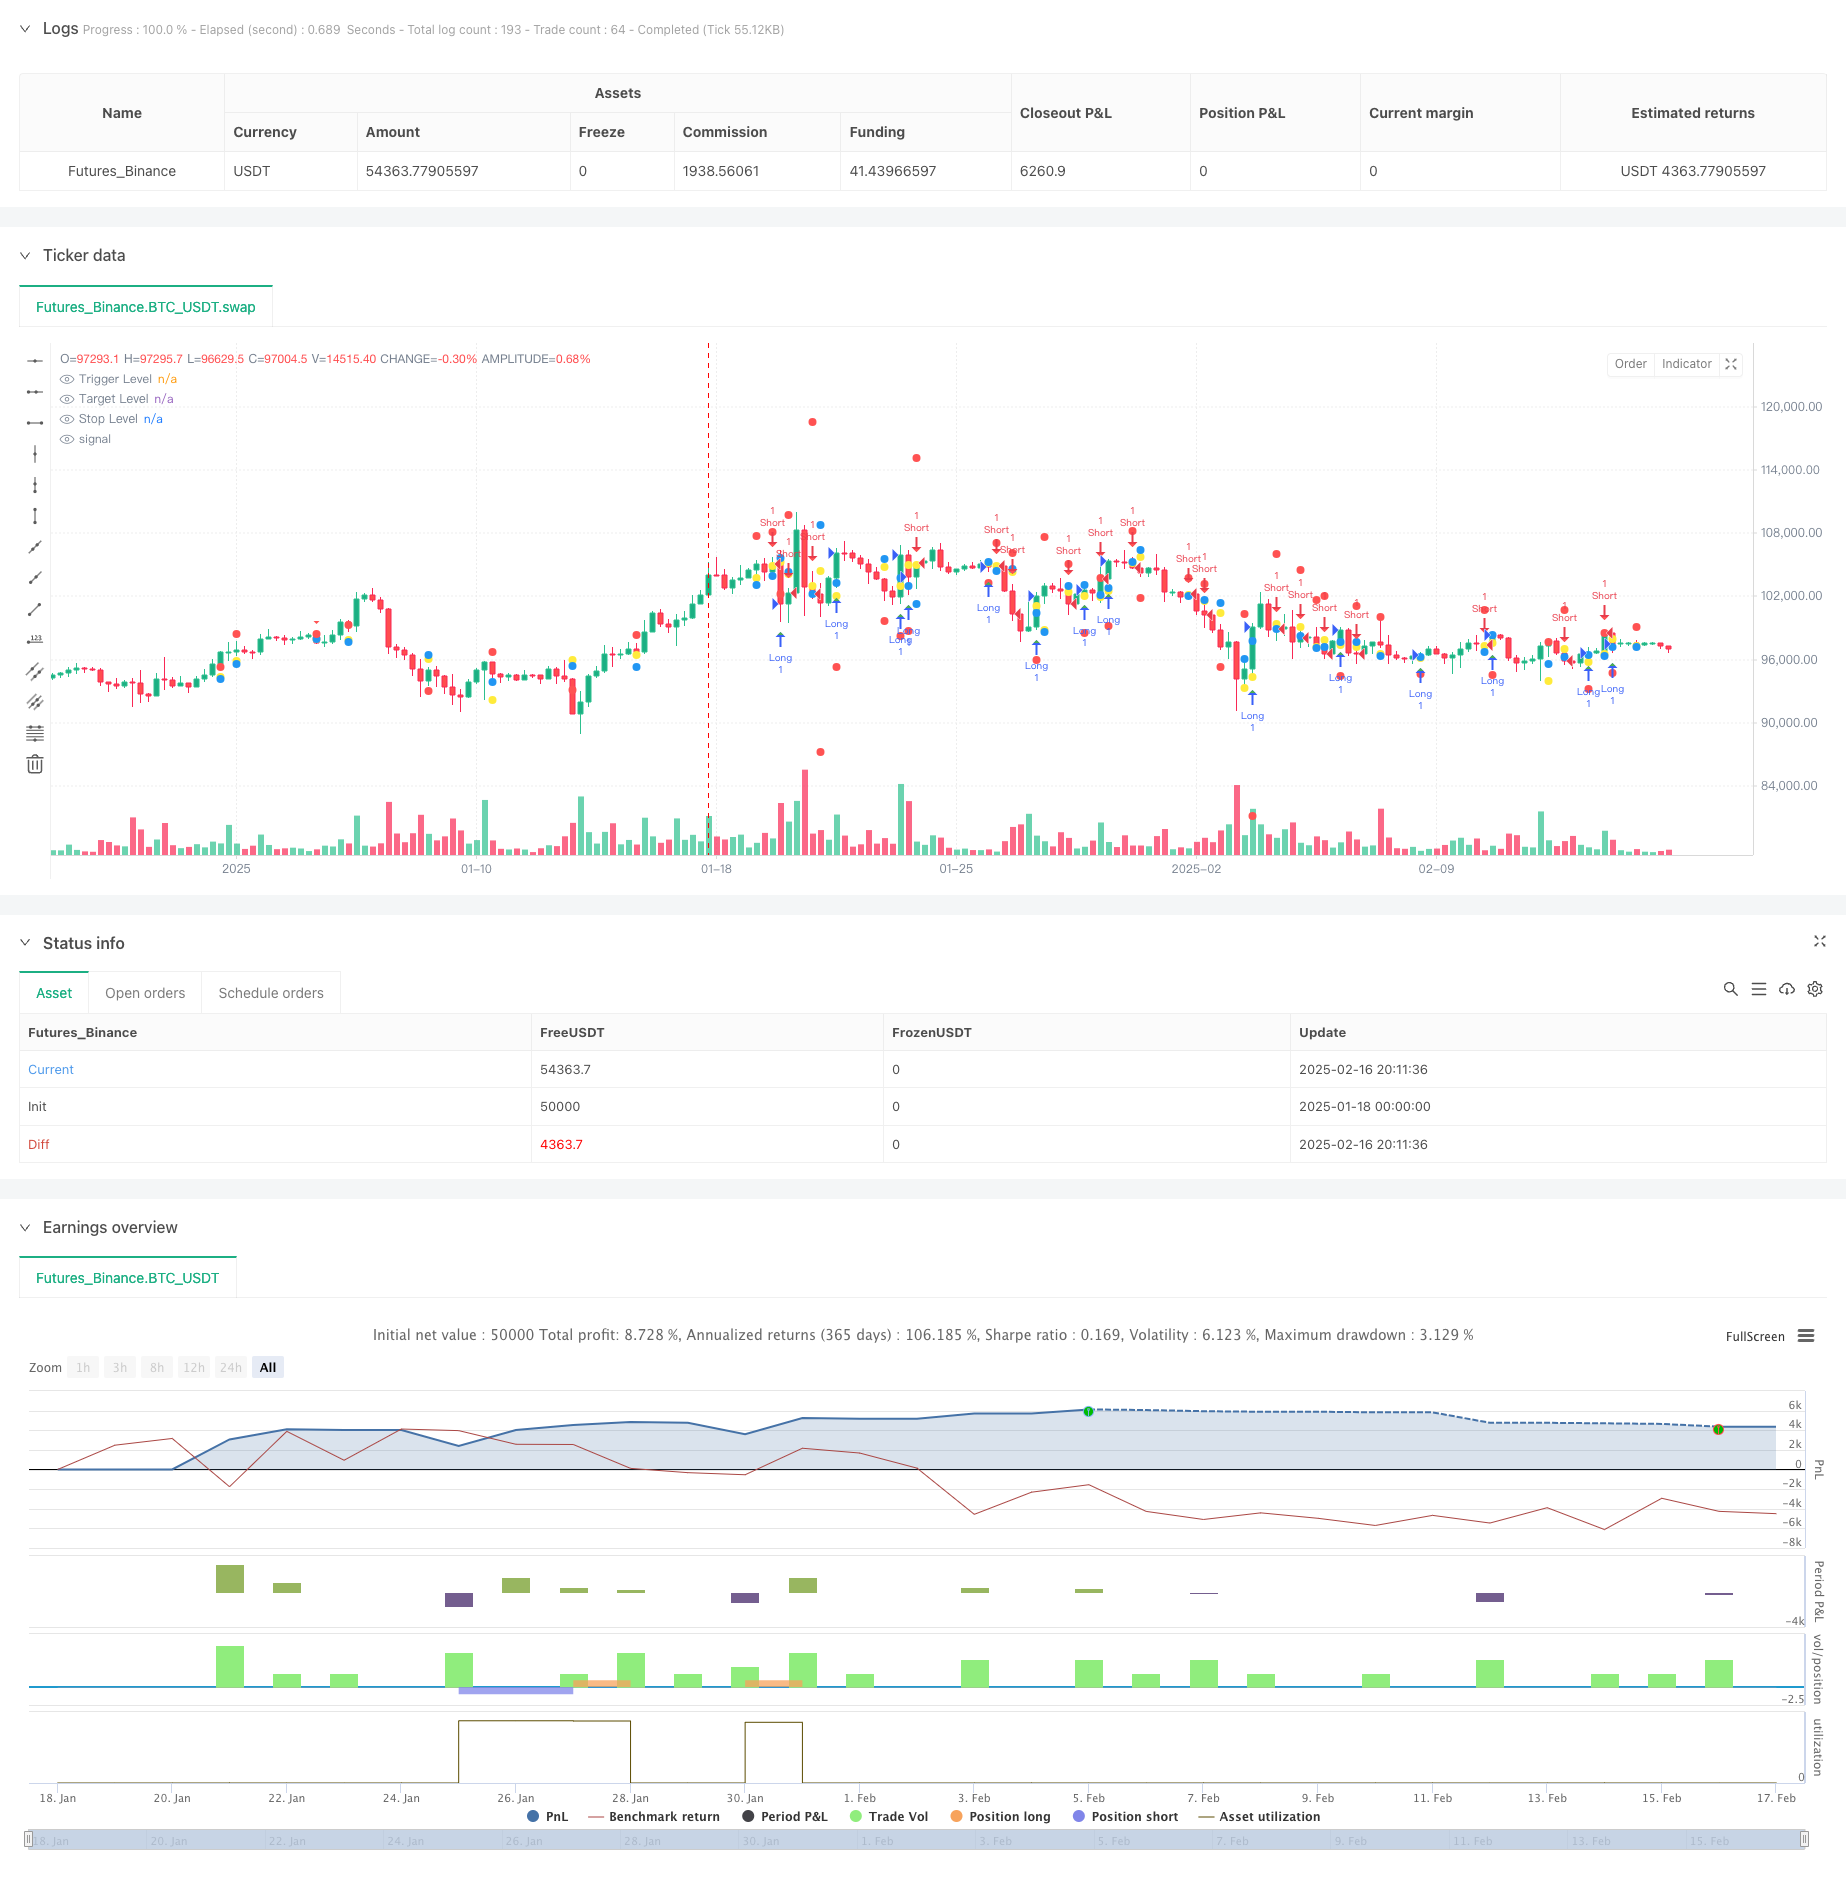
这是一个基于蜡烛图区间理论的多时间周期交易策略。该策略主要通过分析更高时间周期的蜡烛图形态和价格区间来识别潜在的交易机会。策略整合了成交量过滤器和动态止损机制,通过对前期高低点的突破来捕捉趋势性机会。
策略原理
策略的核心是在更高时间周期(默认4小时)监测价格突破前期区间的情况。具体来说: 1. 策略会持续跟踪并存储前两根高时间周期K线的高低点数据 2. 当前一根K线收盘价低于前高且当前K线创新高时,形成做空信号 3. 当前一根K线收盘价高于前低且当前K线创新低时,形成做多信号 4. 入场价格设定在触发K线的高低点位置 5. 获利目标设置在前期相应的高低点位置 6. 止损距离根据区间大小动态调整
策略优势
- 多时间周期分析提供更可靠的信号
- 动态止损设置,根据市场波动度自适应调整
- 可选的成交量过滤机制增加交易确认度
- 清晰的视觉化界面,包括触发价位、目标价位和止损位的标记
- 策略逻辑简单明确,易于理解和执行
- 适用于各种交易品种和市场环境
策略风险
- 在区间震荡市场可能产生频繁的假突破信号
- 较大的止损倍数可能导致单次损失过大
- 依赖历史价格数据,在快速变化的市场环境中可能反应滞后
- 没有考虑基本面因素的影响
- 在流动性较差的市场中可能难以有效执行
策略优化方向
- 引入趋势过滤器,如移动平均线或ADX指标
- 增加更多的市场环境判断条件
- 优化止损策略,可考虑引入移动止损
- 加入交易量管理模块
- 考虑增加更多的时间周期配合分析
- 引入波动率指标来优化区间判断
总结
这是一个结构完整、逻辑清晰的多时间周期交易策略。通过分析更高时间周期的价格行为来寻找潜在的趋势性机会,同时整合了风险管理和过滤机制。策略的核心优势在于其适应性和可扩展性,通过简单的参数调整就能适应不同的市场环境。虽然存在一些固有的风险,但通过建议的优化方向可以进一步提升策略的稳定性和可靠性。
策略源码
/*backtest
start: 2025-01-18 00:00:00
end: 2025-02-17 00:00:00
period: 6h
basePeriod: 6h
exchanges: [{"eid":"Futures_Binance","currency":"BTC_USDT"}]
*/

//@version=6
strategy("Candle Range Theory Strategy", overlay=true)

// Input parameters
var string HTF = input.timeframe("240", "Higher Timeframe (Minutes)")  // 4H default
var float stopLossMultiplier = input.float(1.5, "Stop Loss Multiplier", minval=0.5)
var bool useVolFilter = input.bool(false, "Use Volume Filter")
var float volThreshold = input.float(1.5, "Volume Threshold Multiplier", minval=1.0)

// Function to get higher timeframe data
getHtfData(src) =>
    request.security(syminfo.tickerid, HTF, src)

// Calculate volume condition once per bar
var bool volCondition = true
if useVolFilter
    float vol = getHtfData(volume)
    float avgVol = ta.sma(vol, 20)
    volCondition := vol > avgVol * volThreshold

// Get HTF candle data
htf_open = getHtfData(open)
htf_high = getHtfData(high)
htf_low = getHtfData(low)
htf_close = getHtfData(close)

// Store previous candle data
var float h1 = na  // High of Candle 1
var float l1 = na  // Low of Candle 1
var float h2 = na  // High of Candle 2
var float l2 = na  // Low of Candle 2
var float prevClose = na

// Track setup conditions
var string setupType = na
var float triggerLevel = na
var float targetLevel = na
var float stopLevel = na

// Update candle data - fixed time function usage
var bool isNewBar = false
isNewBar := ta.change(request.security(syminfo.tickerid, HTF, time)) != 0

if isNewBar
    h1 := h2
    l1 := l2
    h2 := htf_high[1]
    l2 := htf_low[1]
    prevClose := htf_close[1]

    // Identify setup conditions
    if not na(h1) and not na(h2) and not na(prevClose)
        if (h2 > h1 and prevClose < h1)  // Short setup
            setupType := "short"
            triggerLevel := l2
            targetLevel := l1
            stopLevel := h2 + (h2 - l1) * stopLossMultiplier
        else if (l2 < l1 and prevClose > l1)  // Long setup
            setupType := "long"
            triggerLevel := h2
            targetLevel := h1
            stopLevel := l2 - (h1 - l2) * stopLossMultiplier
        else
            setupType := na
            triggerLevel := na
            targetLevel := na
            stopLevel := na

// Entry conditions using pre-calculated volume condition - fixed line breaks
bool longCondition = setupType == "long" and high > triggerLevel and not na(triggerLevel) and volCondition
bool shortCondition = setupType == "short" and low < triggerLevel and not na(triggerLevel) and volCondition

// Execute trades
if longCondition
    strategy.entry("Long", strategy.long, comment="Long Entry")
    strategy.exit("Long Exit", "Long", limit=targetLevel, stop=stopLevel)

if shortCondition
    strategy.entry("Short", strategy.short, comment="Short Entry")
    strategy.exit("Short Exit", "Short", limit=targetLevel, stop=stopLevel)

// Plot signals - fixed plotshape parameters
plotshape(series=longCondition, title="Long Signal", location=location.belowbar, color=color.green, style=shape.triangleup)
plotshape(series=shortCondition, title="Short Signal", location=location.abovebar, color=color.red, style=shape.triangledown)

plot(triggerLevel, "Trigger Level", color=color.yellow, style=plot.style_circles)
plot(targetLevel, "Target Level", color=color.blue, style=plot.style_circles)
plot(stopLevel, "Stop Level", color=color.red, style=plot.style_circles)
相关推荐