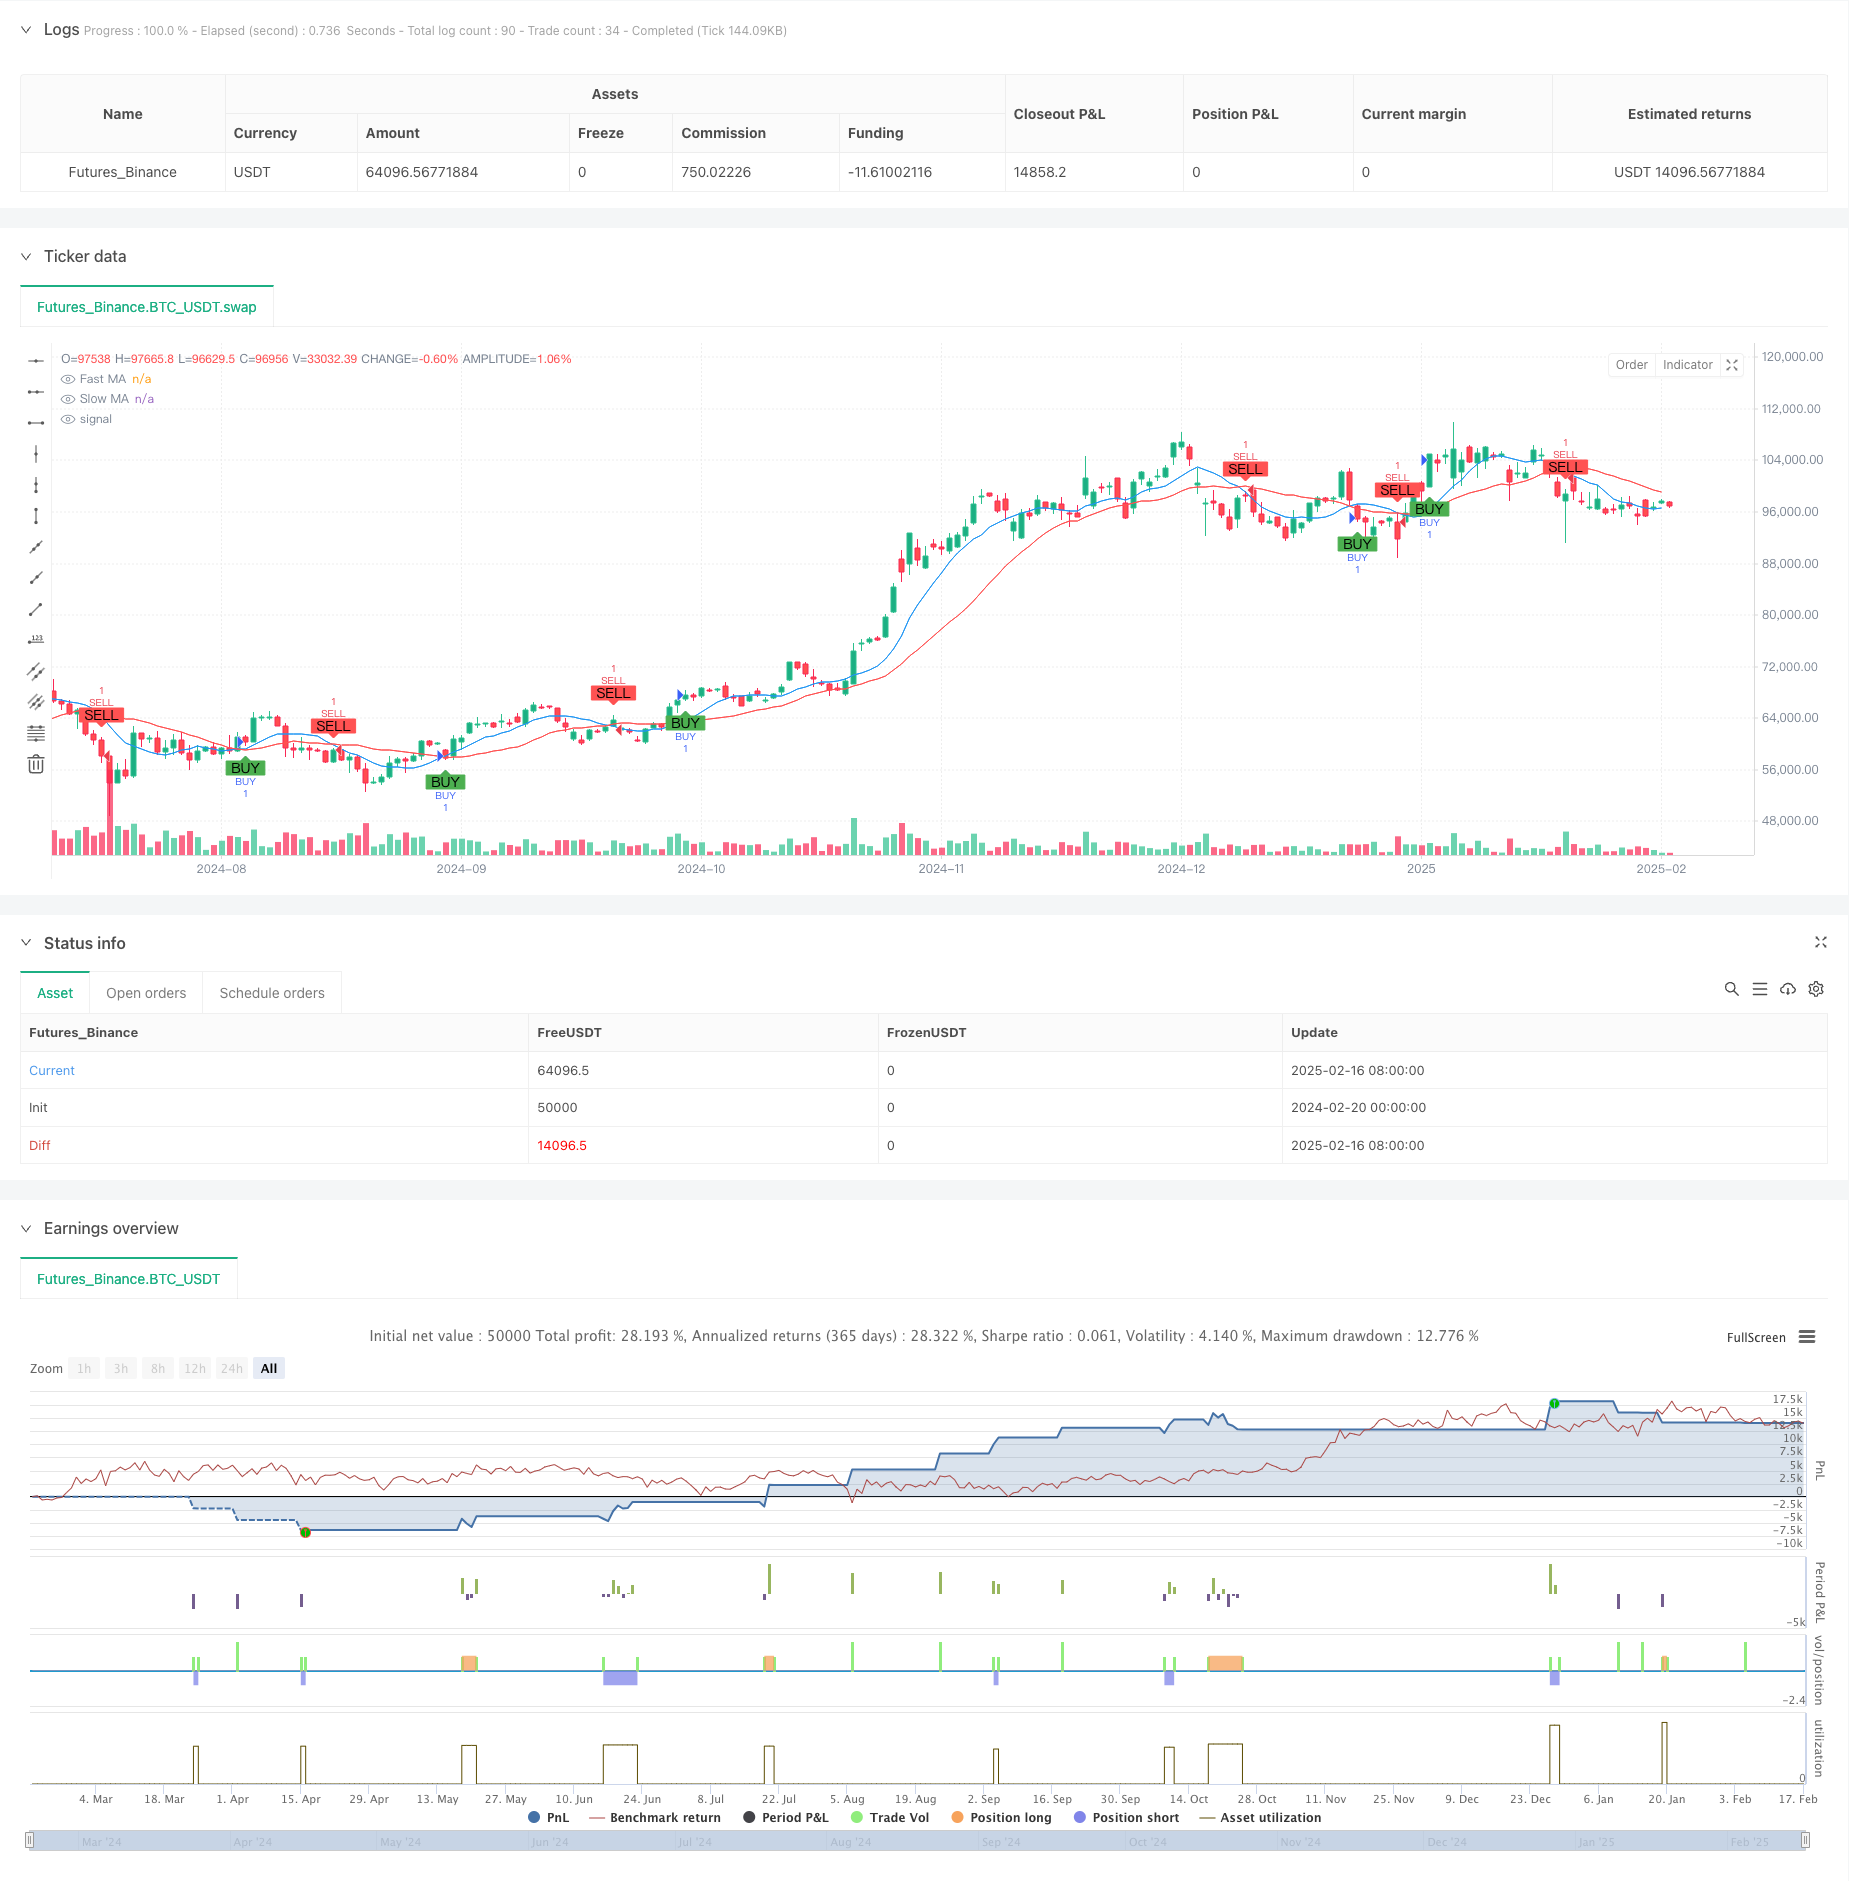
概述
该策略是一个结合了斐波那契回撤水平、移动均线交叉和动量趋势判断的综合交易系统。它通过快速移动均线与慢速移动均线的交叉来产生交易信号,同时利用斐波那契回撤水平作为重要的价格参考点,并结合了趋势判断来优化交易时机。系统还集成了百分比止损和止盈设置,以实现风险管理。
策略原理
策略的核心逻辑基于以下几个关键要素: 1. 移动均线交叉系统使用9日和21日简单移动均线(SMA)作为信号指标 2. 在100个周期内计算的斐波那契回撤水平(23.6%, 38.2%, 50%, 61.8%)用于市场结构分析 3. 通过价格与快速均线的位置关系判断市场趋势 4. 建仓信号由快速均线上穿慢速均线(做多)或下穿慢速均线(做空)触发 5. 系统自动设置基于入场价格的百分比止损和止盈水平
策略优势
- 多维度分析:结合技术分析中最受认可的三大要素(趋势、动量、价格水平)
- 风险管理完善:采用预设的止损止盈比例,保护资金安全
- 可视化程度高:在图表上清晰显示所有关键价格水平和交易信号
- 适应性强:可通过参数调整适应不同市场环境
- 操作规则明确:信号生成条件清晰,避免主观判断
策略风险
- 移动均线系统在震荡市场可能产生虚假信号
- 固定百分比的止损止盈设置可能不适合所有市场环境
- 在高波动性市场中,价格可能快速突破止损位
- 斐波那契水平的有效性可能随市场条件变化而改变
- 趋势判断可能在市场转折点出现滞后
策略优化方向
- 引入波动率指标来动态调整止损止盈比例
- 增加成交量分析来确认交易信号
- 考虑在不同时间周期的确认来提高信号可靠性
- 加入市场环境筛选条件,在适合的市场条件下交易
- 开发自适应的参数优化系统
总结
这是一个融合多个经典技术分析工具的综合性交易策略。通过结合移动均线、斐波那契回撤和趋势分析,策略能够在市场中捕捉潜在的交易机会。同时,完善的风险管理系统和清晰的可视化界面使其具有较好的实用性。虽然存在一些固有风险,但通过持续优化和改进,该策略有望在实际交易中取得更好的表现。
策略源码
/*backtest
start: 2024-02-20 00:00:00
end: 2025-02-17 08:00:00
period: 1d
basePeriod: 1d
exchanges: [{"eid":"Futures_Binance","currency":"BTC_USDT"}]
*/

//@version=5
strategy("Buy/Sell Strategy with TP, SL, Fibonacci Levels, and Trend", overlay=true)

// Input for stop loss and take profit percentages
stopLossPercentage = input.int(2, title="Stop Loss (%)") // Stop loss percentage
takeProfitPercentage = input.int(4, title="Take Profit (%)") // Take profit percentage

// Example of a moving average crossover strategy
fastLength = input.int(9, title="Fast MA Length")
slowLength = input.int(21, title="Slow MA Length")

fastMA = ta.sma(close, fastLength)
slowMA = ta.sma(close, slowLength)

// Entry conditions (Buy when fast MA crosses above slow MA, Sell when fast MA crosses below slow MA)
longCondition = ta.crossover(fastMA, slowMA)
shortCondition = ta.crossunder(fastMA, slowMA)

// Plot moving averages for visual reference
plot(fastMA, color=color.blue, title="Fast MA")
plot(slowMA, color=color.red, title="Slow MA")

// Fibonacci Retracement Levels
lookback = input.int(100, title="Lookback Period for Fibonacci Levels")
highLevel = ta.highest(high, lookback)
lowLevel = ta.lowest(low, lookback)

fib236 = lowLevel + (highLevel - lowLevel) * 0.236
fib382 = lowLevel + (highLevel - lowLevel) * 0.382
fib50 = lowLevel + (highLevel - lowLevel) * 0.5
fib618 = lowLevel + (highLevel - lowLevel) * 0.618

// Display Fibonacci levels as text on the chart near price panel (left of candle)
label.new(bar_index, fib236, text="Fib 23.6%: " + str.tostring(fib236, "#.##"), style=label.style_label_left, color=color.purple, textcolor=color.white, size=size.small, xloc=xloc.bar_index, yloc=yloc.price)
label.new(bar_index, fib382, text="Fib 38.2%: " + str.tostring(fib382, "#.##"), style=label.style_label_left, color=color.blue, textcolor=color.white, size=size.small, xloc=xloc.bar_index, yloc=yloc.price)
label.new(bar_index, fib50, text="Fib 50%: " + str.tostring(fib50, "#.##"), style=label.style_label_left, color=color.green, textcolor=color.white, size=size.small, xloc=xloc.bar_index, yloc=yloc.price)
label.new(bar_index, fib618, text="Fib 61.8%: " + str.tostring(fib618, "#.##"), style=label.style_label_left, color=color.red, textcolor=color.white, size=size.small, xloc=xloc.bar_index, yloc=yloc.price)

// Trend condition: Price uptrend or downtrend
trendCondition = close > fastMA ? "Uptrending" : close < fastMA ? "Downtrending" : "Neutral"

// Remove previous trend label and add new trend label
var label trendLabel = na
if (not na(trendLabel))
    label.delete(trendLabel)

// Create a new trend label based on the current trend
trendLabel := label.new(bar_index, close, text="Trend: " + trendCondition, style=label.style_label_left, color=color.blue, textcolor=color.white, size=size.small, xloc=xloc.bar_index, yloc=yloc.price)

// Buy and Sell orders with Stop Loss and Take Profit
if (longCondition)
    // Set the Stop Loss and Take Profit levels based on entry price
    stopLossLevel = close * (1 - stopLossPercentage / 100)
    takeProfitLevel = close * (1 + takeProfitPercentage / 100)
    // Enter long position with stop loss and take profit levels
    strategy.entry("BUY", strategy.long)
    strategy.exit("Sell", "BUY", stop=stopLossLevel, limit=takeProfitLevel)

    // Display TP, SL, and Entry price labels on the chart near price panel (left of candle)
    label.new(bar_index, takeProfitLevel, text="TP\n" + str.tostring(takeProfitLevel, "#.##"), style=label.style_label_left, color=color.green, textcolor=color.white, size=size.small, xloc=xloc.bar_index, yloc=yloc.price)
    label.new(bar_index, stopLossLevel, text="SL\n" + str.tostring(stopLossLevel, "#.##"), style=label.style_label_left, color=color.red, textcolor=color.white, size=size.small, xloc=xloc.bar_index, yloc=yloc.price)
    label.new(bar_index, close, text="BUY\n" + str.tostring(close, "#.##"), style=label.style_label_left, color=color.blue, textcolor=color.white, size=size.small, xloc=xloc.bar_index, yloc=yloc.price)

if (shortCondition)
    // Set the Stop Loss and Take Profit levels based on entry price
    stopLossLevel = close * (1 + stopLossPercentage / 100)
    takeProfitLevel = close * (1 - takeProfitPercentage / 100)
    // Enter short position with stop loss and take profit levels
    strategy.entry("SELL", strategy.short)
    strategy.exit("Cover", "SELL", stop=stopLossLevel, limit=takeProfitLevel)

    // Display TP, SL, and Entry price labels on the chart near price panel (left of candle)
    label.new(bar_index, takeProfitLevel, text="TP\n" + str.tostring(takeProfitLevel, "#.##"), style=label.style_label_left, color=color.green, textcolor=color.white, size=size.small, xloc=xloc.bar_index, yloc=yloc.price)
    label.new(bar_index, stopLossLevel, text="SL\n" + str.tostring(stopLossLevel, "#.##"), style=label.style_label_left, color=color.red, textcolor=color.white, size=size.small, xloc=xloc.bar_index, yloc=yloc.price)
    label.new(bar_index, close, text="SELL\n" + str.tostring(close, "#.##"), style=label.style_label_left, color=color.orange, textcolor=color.white, size=size.small, xloc=xloc.bar_index, yloc=yloc.price)

// Plot Buy/Sell labels on chart
plotshape(series=longCondition, title="BUY Signal", location=location.belowbar, color=color.green, style=shape.labelup, text="BUY")
plotshape(series=shortCondition, title="SELL Signal", location=location.abovebar, color=color.red, style=shape.labeldown, text="SELL")
相关推荐