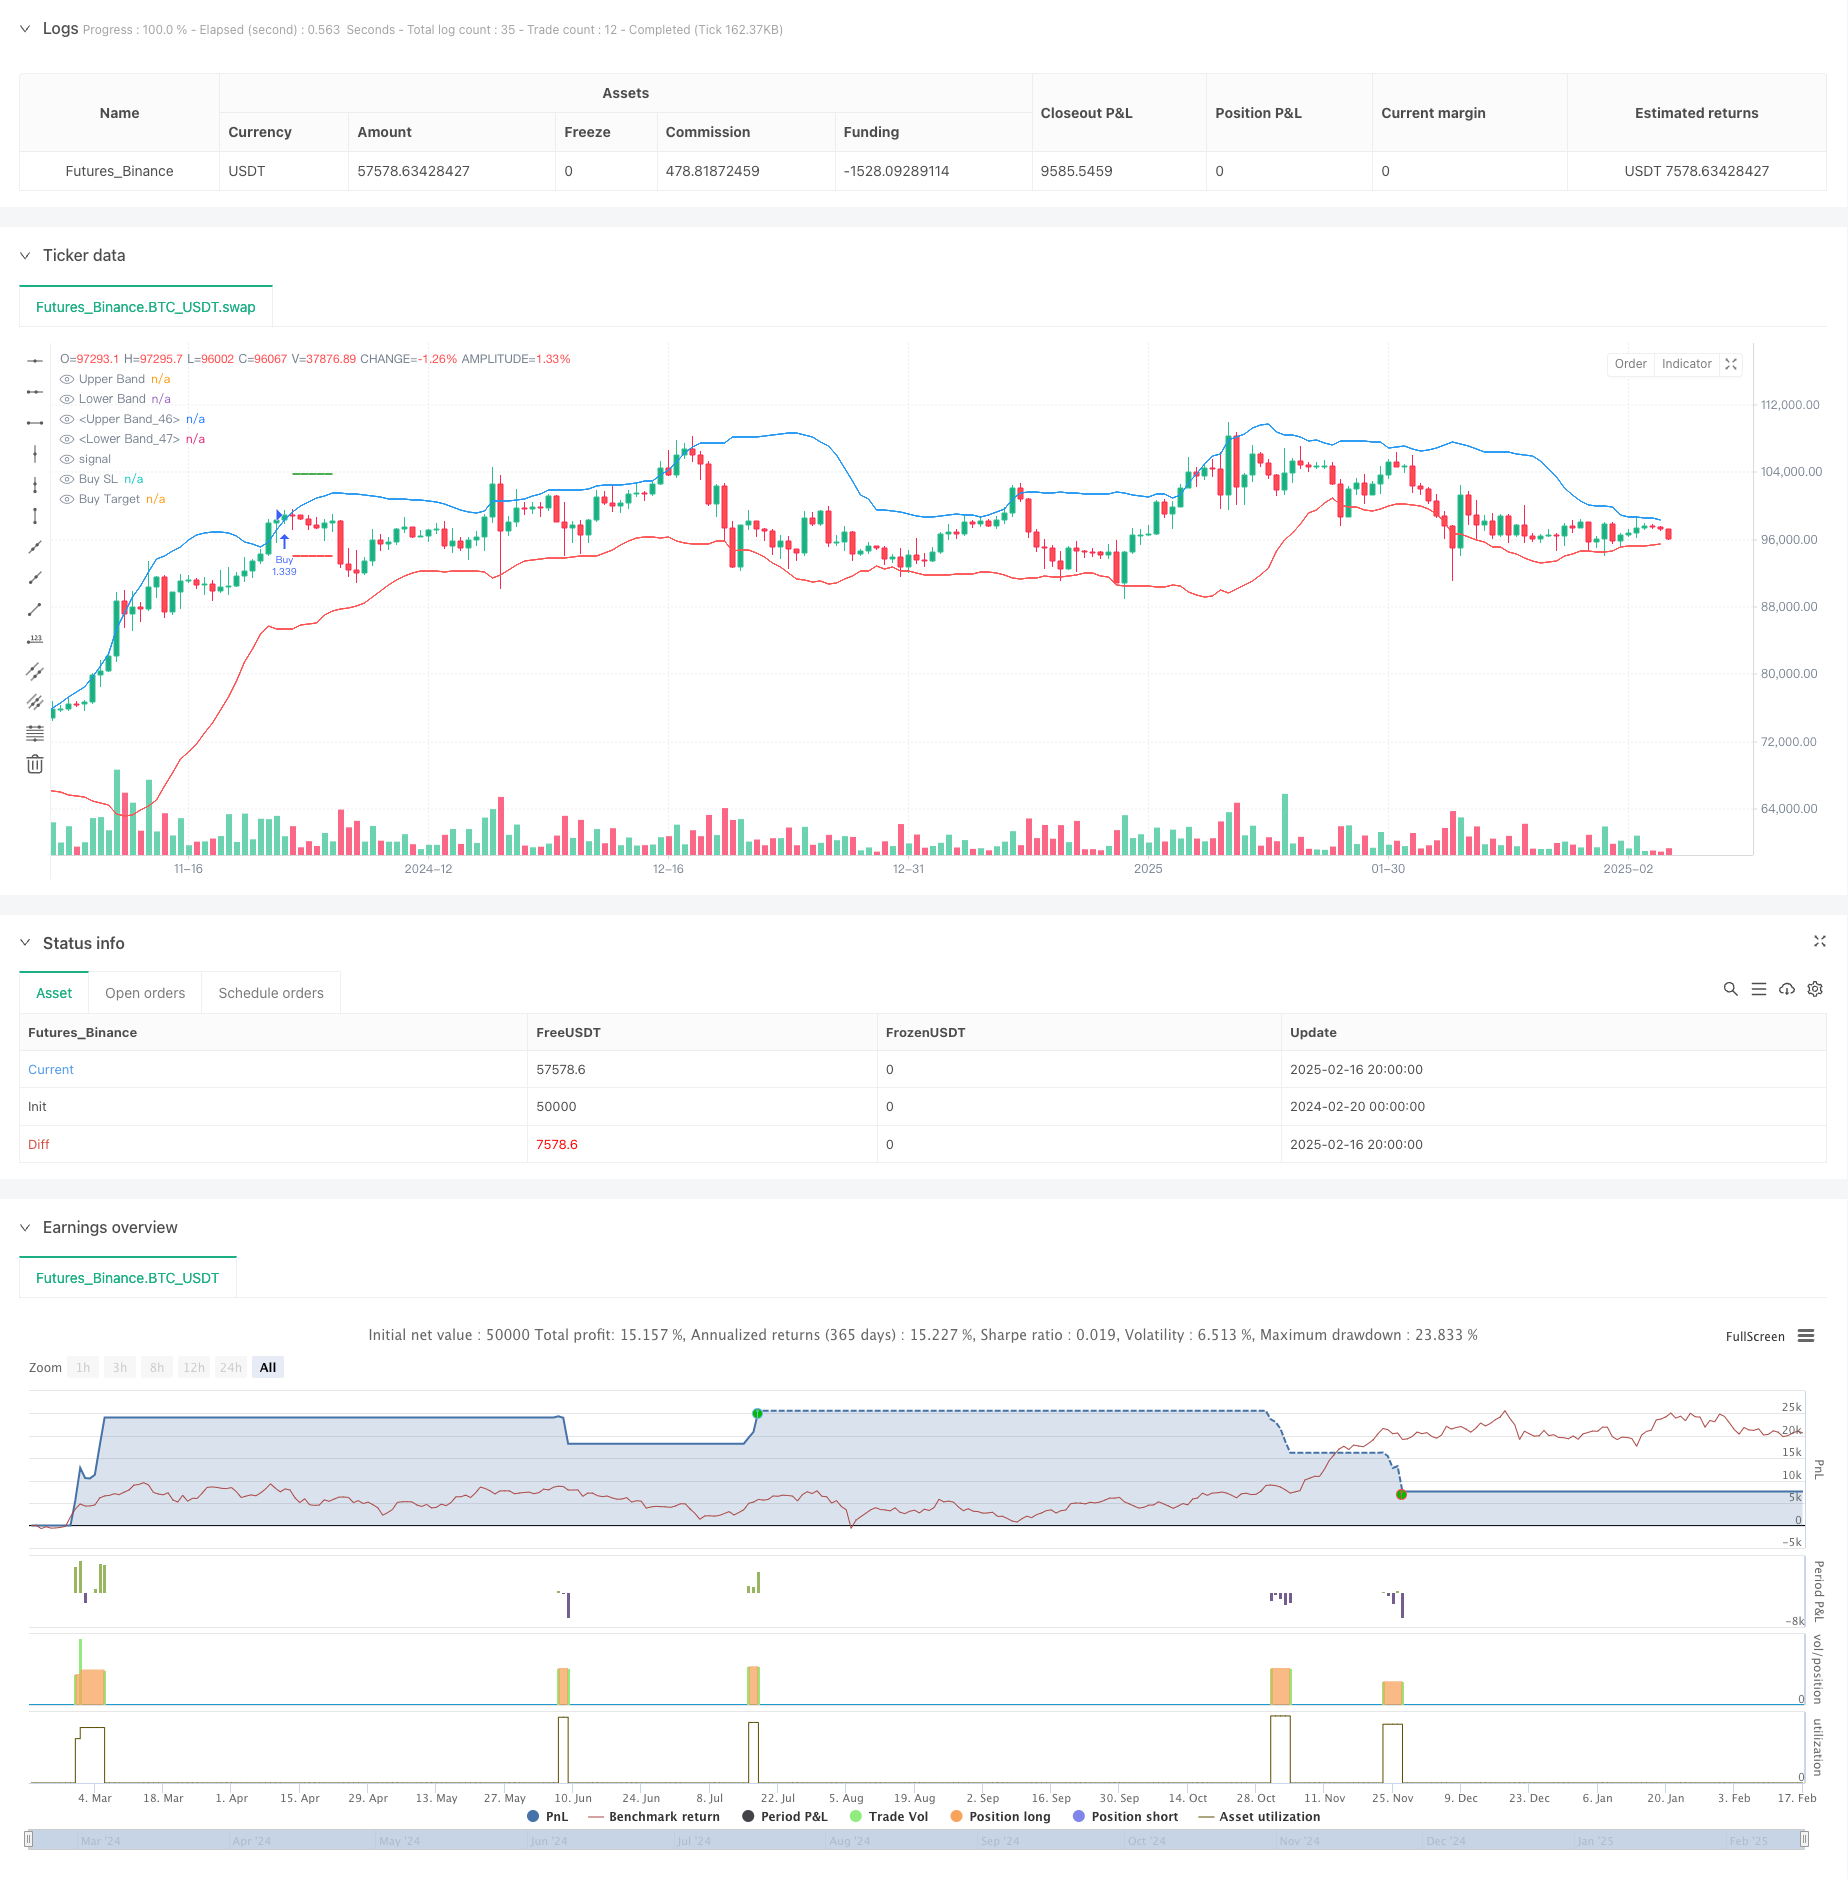
概述
该策略是一个基于布林带突破和蜡烛线形态的趋势跟踪交易系统。策略通过识别连续三根突破布林带的蜡烛线,并结合收盘价在蜡烛线实体中的位置来确定交易信号。系统采用了固定的1:1风险收益比来管理每笔交易的止损和止盈。
策略原理
策略的核心逻辑基于以下几个关键要素: 1. 使用20周期的布林带作为主要指标,标准差倍数为2.0 2. 多头入场条件:连续三根K线收盘价突破上轨,且这三根K线都是阳线,收盘价都位于实体上半部分 3. 空头入场条件:连续三根K线收盘价突破下轨,且这三根K线都是阴线,收盘价都位于实体下半部分 4. 止损设置在最早那根信号K线的极值处 5. 基于1:1的风险收益比设置止盈位置
策略优势
- 采用多重确认机制,通过连续三根突破K线的形态要求,有效降低假突破的风险
- 结合收盘价在K线实体中的位置判断,增强了趋势确认的可靠性
- 使用固定的风险收益比进行仓位管理,便于风险控制
- 策略逻辑清晰,易于理解和执行
- 通过标记功能直观显示交易信号,便于回测分析
策略风险
- 在震荡市场中可能产生频繁的假信号
- 固定的风险收益比可能无法充分把握强趋势行情
- 连续三根K线的严格要求可能错过一些潜在的好机会
- 止损设置在信号K线极值处,在波动较大时止损位置可能过远 建议通过以下方式管理风险:
- 结合市场波动周期调整布林带参数
- 根据市场特征动态调整风险收益比
- 增加趋势确认指标
- 优化止损位置设置方法
策略优化方向
- 参数优化:
- 可以根据不同市场特征动态调整布林带周期和标准差倍数
- 考虑将三根K线的要求改为动态判断
- 信号优化:
- 增加趋势确认指标如ADX或趋势线
- 引入成交量确认机制
- 考虑加入摆动指标作为辅助
- 仓位管理优化:
- 实现动态的风险收益比设置
- 增加资金管理模块
- 考虑分批建仓和平仓机制
- 止损优化:
- 引入跟踪止损机制
- 基于ATR设置止损距离
- 考虑时间止损
总结
这是一个结构完整、逻辑清晰的趋势跟踪策略。通过布林带突破和蜡烛线形态的多重确认机制,有效降低了假信号风险。固定的风险收益比设置简化了交易管理,但也限制了策略的灵活性。通过优化参数设置、增加确认指标、改进仓位管理等方式,策略仍有较大的改进空间。整体而言,这是一个具有实用价值的基础策略框架,可以根据具体需求进行进一步完善。
策略源码
/*backtest
start: 2024-02-20 00:00:00
end: 2025-02-17 08:00:00
period: 12h
basePeriod: 12h
exchanges: [{"eid":"Futures_Binance","currency":"BTC_USDT"}]
*/

//@version=6
strategy("Bollinger Band Strategy (Close Near High/Low Relative to Half Range)", overlay=true, default_qty_type=strategy.percent_of_equity, default_qty_value=200, pyramiding=0)

// Bollinger Bands
length = input.int(20, "BB Length")
mult = input.float(2.0, "BB StdDev")
basis = ta.sma(close, length)
upper_band = basis + mult * ta.stdev(close, length)
lower_band = basis - mult * ta.stdev(close, length)

// Plot Bollinger Bands
plot(upper_band, "Upper Band", color.blue)
plot(lower_band, "Lower Band", color.red)

// Buy Condition:
// 1. Last 3 candles close above upper band AND close > open for all 3 candles
// 2. Close is in the top half of the candle's range (close > (high + low) / 2)
buyCondition =    close[2] > upper_band[2] and     close[1] > upper_band[1] and     close > upper_band and    close[2] > open[2] and close[2] > (high[2] + low[2]) / 2 and    close[1] > open[1] and close[1] > (high[1] + low[1]) / 2 and    close > open and close > (high + low) / 2

// Sell Condition:
// 1. Last 3 candles close below lower band AND close < open for all 3 candles
// 2. Close is in the bottom half of the candle's range (close < (high + low) / 2)
sellCondition =    close[2] < lower_band[2] and    close[1] < lower_band[1] and   close < lower_band and   close[2] < open[2] and close[2] < (high[2] + low[2]) / 2 and    close[1] < open[1] and close[1] < (high[1] + low[1]) / 2 and    close < open and close < (high + low) / 2

// Initialize variables
var float stop_loss = na
var float target_price = na

// Buy Logic
if buyCondition and strategy.position_size == 0
    stop_loss := low[2] // Low of the earliest candle in the 3-candle sequence
    target_price := close + (close - stop_loss) // Risk-to-reward 1:1
    strategy.entry("Buy", strategy.long)
    strategy.exit("Exit Buy", "Buy", stop=stop_loss, limit=target_price)
    label.new(bar_index, low, "▲", color=color.green, style=label.style_label_up, yloc=yloc.belowbar)

// Sell Logic
if sellCondition and strategy.position_size == 0
    stop_loss := high[2] // High of the earliest candle in the 3-candle sequence
    target_price := close - (stop_loss - close) // Risk-to-reward 1:1
    strategy.entry("Sell", strategy.short)
    strategy.exit("Exit Sell", "Sell", stop=stop_loss, limit=target_price)
    label.new(bar_index, high, "▼", color=color.red, style=label.style_label_down, yloc=yloc.abovebar)

// Plotting
plot(upper_band, "Upper Band", color.blue)
plot(lower_band, "Lower Band", color.red)
plot(strategy.position_size > 0 ? stop_loss : na, "Buy SL", color.red, 2, plot.style_linebr)
plot(strategy.position_size > 0 ? target_price : na, "Buy Target", color.green, 2, plot.style_linebr)
plot(strategy.position_size < 0 ? stop_loss : na, "Sell SL", color.red, 2, plot.style_linebr)
plot(strategy.position_size < 0 ? target_price : na, "Sell Target", color.green, 2, plot.style_linebr)
相关推荐