概述
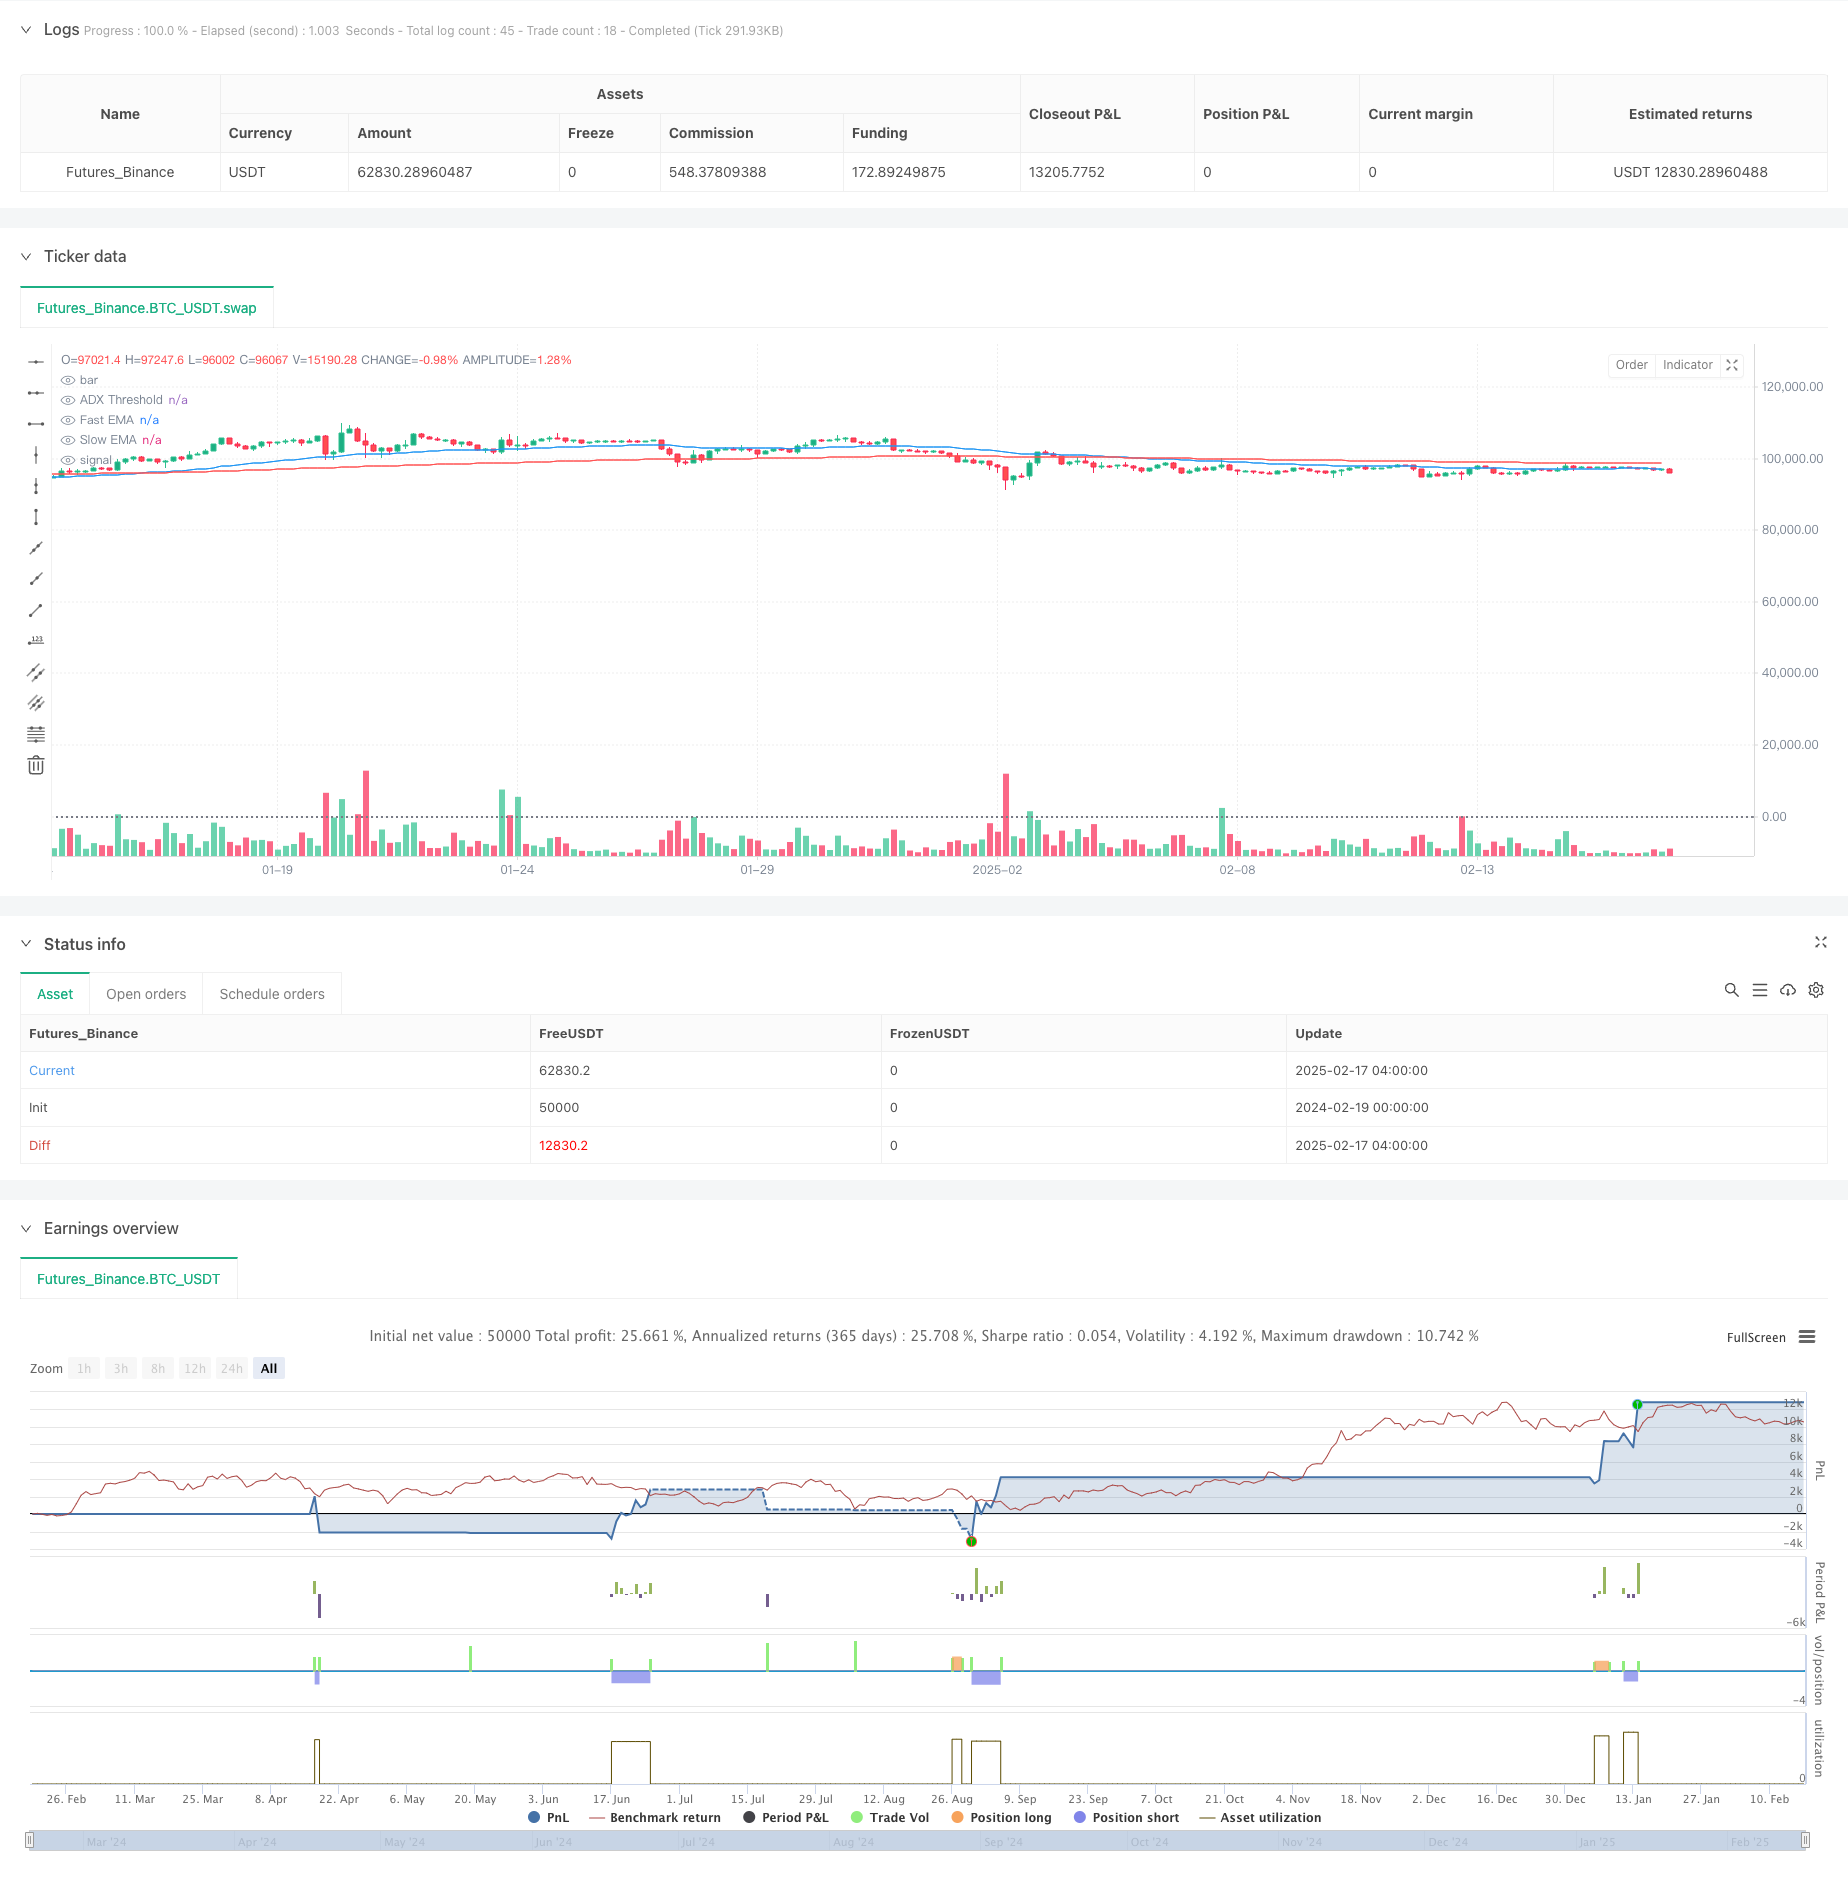
本策略是一个基于多重技术指标的趋势跟踪策略,整合了移动平均线(EMA)、平均趋向指标(ADX)和相对强弱指标(RSI)等多个技术指标,并结合了多时间框架分析方法。策略主要通过快速与慢速EMA的交叉来确认趋势方向,使用ADX来过滤趋势强度,通过RSI来判断市场动量,从而在1分钟图表上进行高频交易。回测结果显示,该策略具有76.92%的胜率和1.819的利润因子,展现出良好的盈利能力。
策略原理
策略运作基于以下核心机制: 1. 使用50周期和200周期的EMA来识别趋势方向,通过快线与慢线的交叉确认入场信号 2. 采用ADX指标(14周期)评估趋势强度,只在ADX大于25时入场,避免震荡市场 3. 结合RSI指标(14周期)进行动量分析,在RSI低于30时考虑做多,高于70时考虑做空 4. 引入4小时时间框架的EMA分析,通过多时间框架确认来增强趋势判断的可靠性 5. 设置动态止盈止损,做多时止盈位于入场价格的5%处,止损位于2%处;做空相应取反
策略优势
- 多重指标交叉验证,显著提高信号可靠性
- 具备完善的风险控制机制,包括动态止损和基于波动率的仓位管理
- 采用多时间框架分析,有效降低假突破风险
- 高胜率和适中的盈亏比,具有良好的期望收益
- 策略逻辑清晰,易于理解和维护
策略风险
- 快速剧烈的市场波动可能导致止损失效
- 横盘震荡市场可能产生频繁交易,增加交易成本
- EMA指标本身具有滞后性,可能错过最佳入场时机
- 多重指标可能产生相互矛盾的信号
- 1分钟周期交易对执行速度要求较高,可能面临滑点风险
策略优化方向
- 优化ADX平滑参数,提高趋势识别准确性
- 引入基于ATR的动态仓位管理,更好地适应市场波动
- 增加成交量分析维度,提高信号可靠性
- 考虑添加市场环境分类,在不同市场条件下使用不同的参数组合
- 可以尝试整合机器学习算法,优化参数选择
总结
该策略通过多重技术指标的协同配合,构建了一个稳健的趋势跟踪系统。策略在保持较高胜率的同时,通过完善的风险控制机制,实现了可观的收益。虽然存在一定的优化空间,但整体表现令人满意,特别适合追求稳健收益的交易者。
策略源码
/*backtest
start: 2024-02-19 00:00:00
end: 2025-02-17 08:00:00
period: 4h
basePeriod: 4h
exchanges: [{"eid":"Futures_Binance","currency":"BTC_USDT"}]
*/

//@version=5
strategy("Enhanced Trend Following Strategy", overlay=true, default_qty_type=strategy.percent_of_equity, default_qty_value=200)

// === INPUTS ===
emaFastLength = input(50, title="Fast EMA Length")
emaSlowLength = input(200, title="Slow EMA Length")
adxLength = input(14, title="ADX Length")
adxSmoothing = input(14, title="ADX Smoothing")
adxThreshold = input(25, title="ADX Threshold")
rsiLength = input(14, title="RSI Length")
rsiOverbought = input(70, title="RSI Overbought Level")
rsiOversold = input(30, title="RSI Oversold Level")

// === INDICATORS ===
emaFast = ta.ema(close, emaFastLength)
emaSlow = ta.ema(close, emaSlowLength)
[dip, dim, adxValue] = ta.dmi(adxLength, adxSmoothing)
rsiValue = ta.rsi(close, rsiLength)

// === MULTI-TIMEFRAME EMA ===
emaFastHTF = request.security(syminfo.tickerid, "240", ta.ema(close, emaFastLength))
emaSlowHTF = request.security(syminfo.tickerid, "240", ta.ema(close, emaSlowLength))

// === CONDITIONS ===
bullishTrend = ta.crossover(emaFast, emaSlow) and adxValue > adxThreshold and rsiValue > rsiOversold
bearishTrend = ta.crossunder(emaFast, emaSlow) and adxValue > adxThreshold and rsiValue < rsiOverbought

// === TRADE EXECUTION ===
if (bullishTrend)
    strategy.entry("Long", strategy.long)
    strategy.exit("TakeProfit_Long", from_entry="Long", limit=close * 1.05, stop=close * 0.98)

if (bearishTrend)
    strategy.entry("Short", strategy.short)
    strategy.exit("TakeProfit_Short", from_entry="Short", limit=close * 0.95, stop=close * 1.02)

// === PLOT INDICATORS ===
plot(emaFast, color=color.blue, title="Fast EMA")
plot(emaSlow, color=color.red, title="Slow EMA")
hline(adxThreshold, "ADX Threshold", color=color.gray, linestyle=hline.style_dotted)

bgcolor(bullishTrend ? color.green : bearishTrend ? color.red : na, transp=90)

// === ALERTS ===
alertcondition(bullishTrend, title="Buy Signal", message="A bullish trend detected!")
alertcondition(bearishTrend, title="Sell Signal", message="A bearish trend detected!")

// === STRATEGY SETTINGS ===
strategy.close("Long", when=rsiValue > rsiOverbought)
strategy.close("Short", when=rsiValue < rsiOversold)
相关推荐