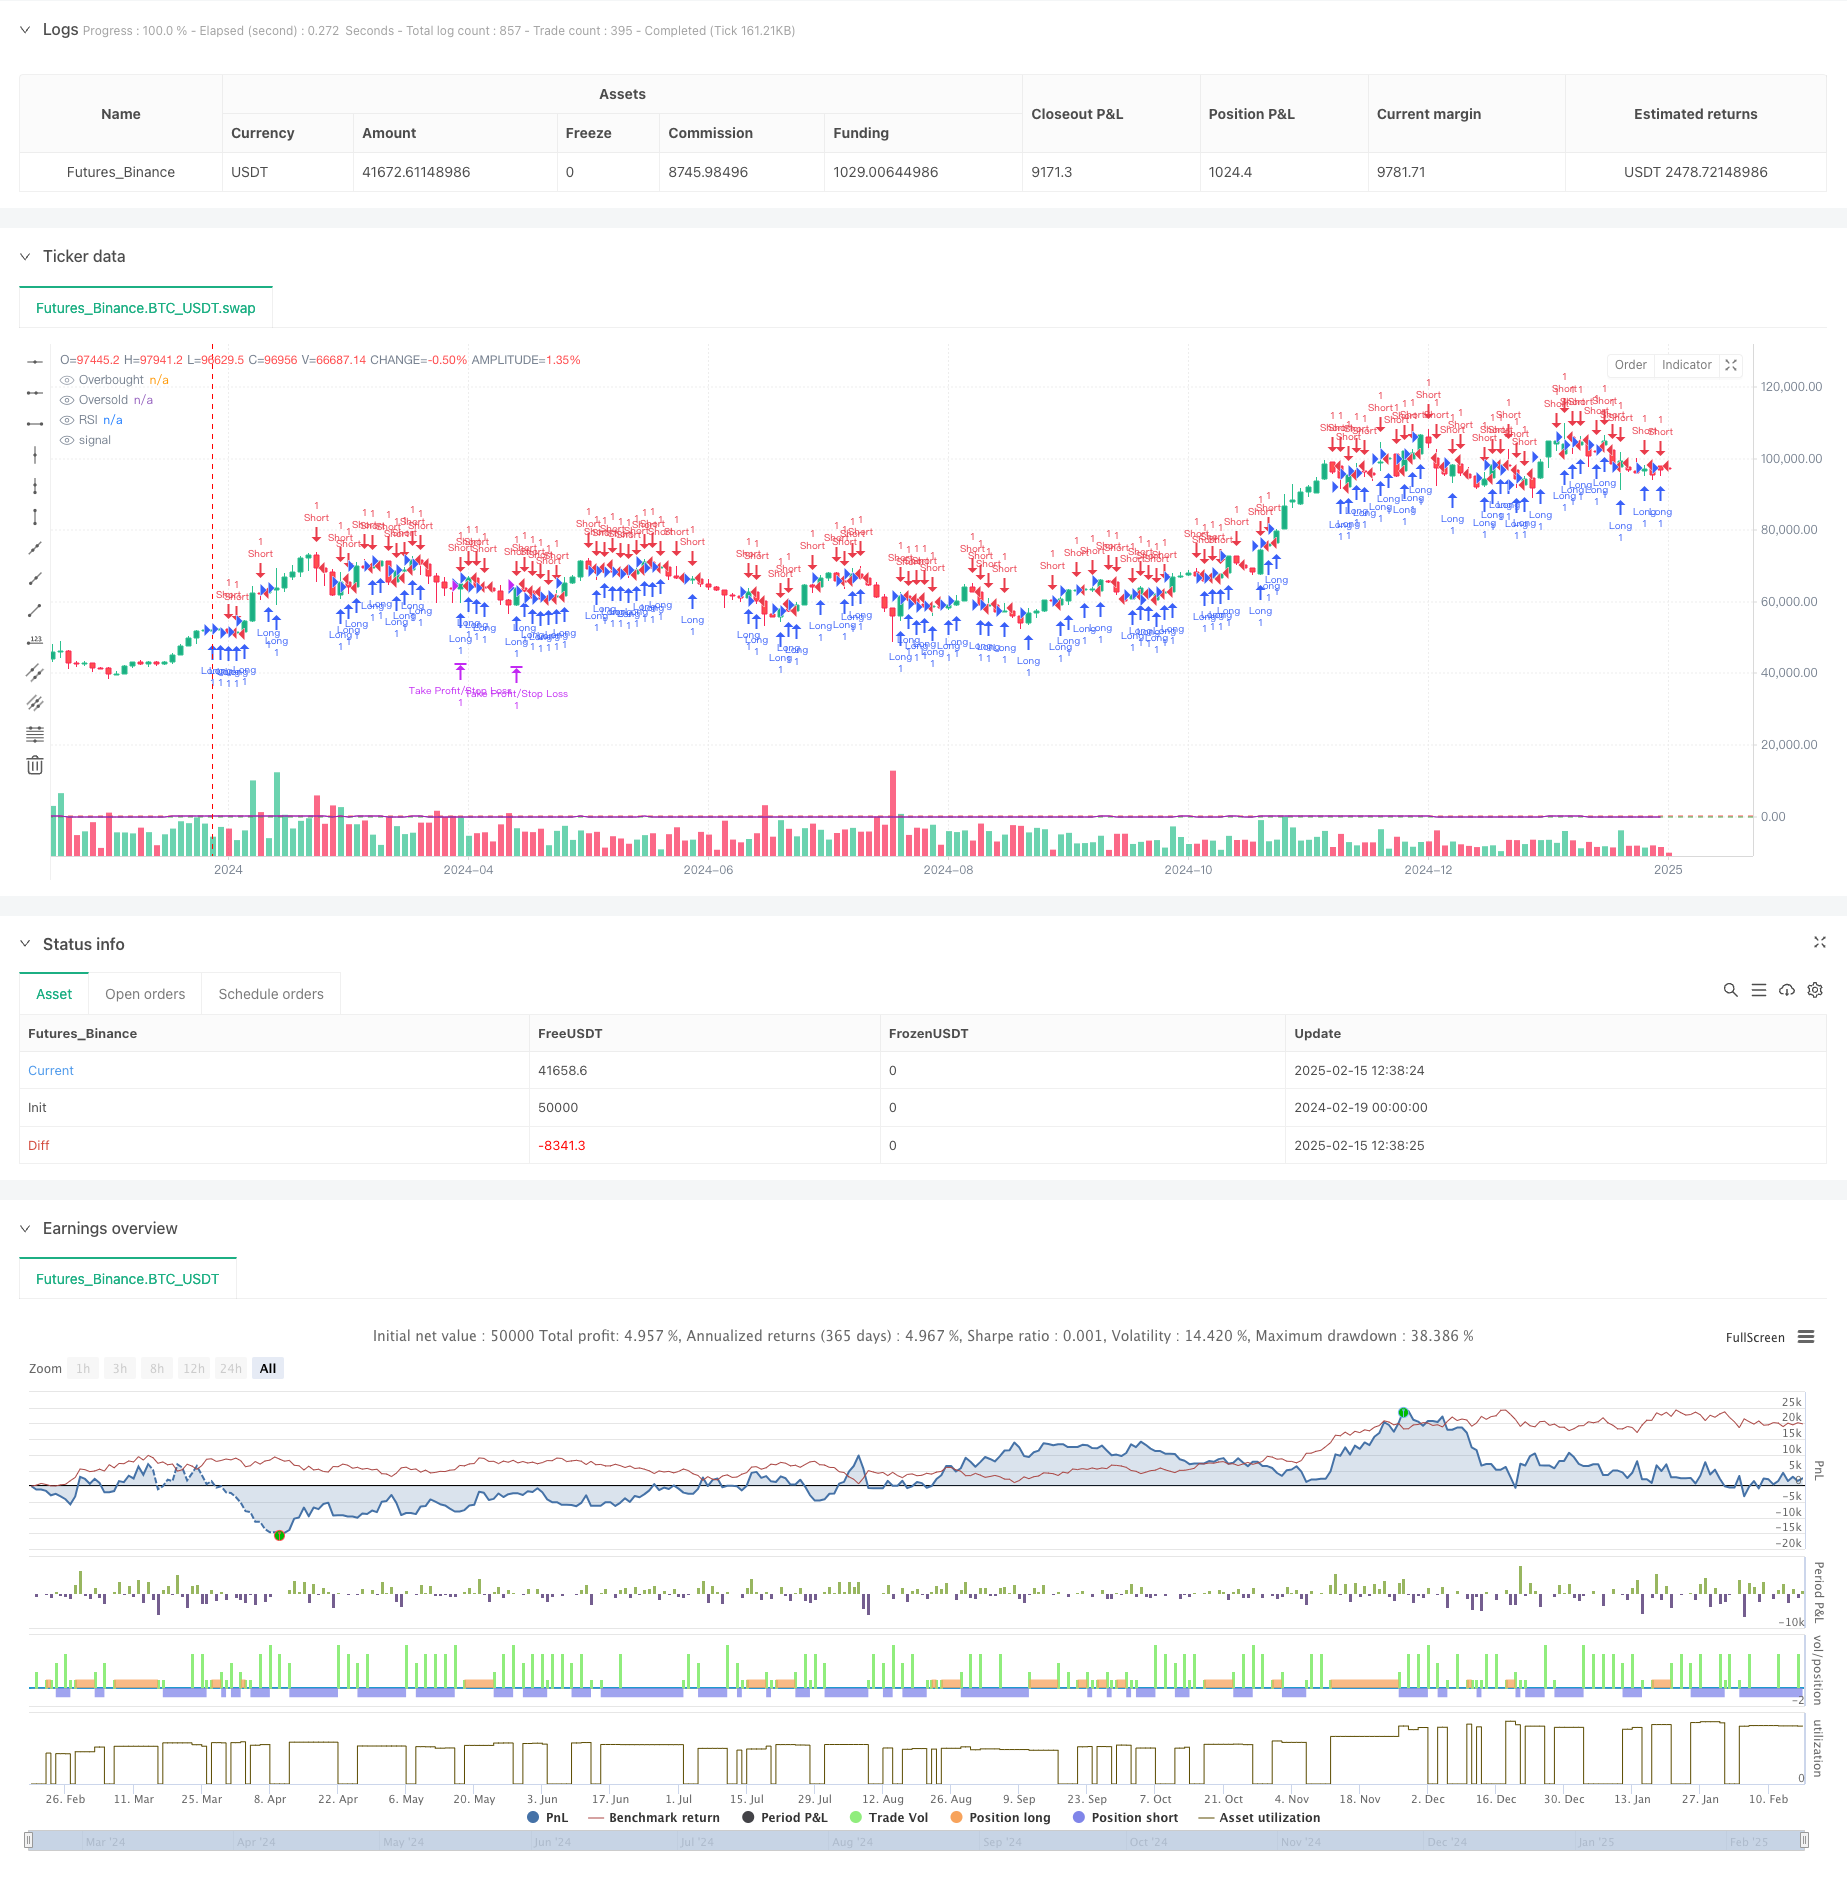
概述
本策略是一个基于RSI(相对强弱指标)突破的趋势跟踪交易系统,结合了1:4的风险收益比来优化交易表现。策略通过识别RSI指标的高点和低点形成的趋势线,在突破时进场,并使用固定的风险收益比来设定止损和止盈位置,实现系统化的交易管理。
策略原理
策略的核心逻辑基于以下几个关键要素: 1. RSI趋势线突破信号:系统通过跟踪RSI的局部高点和低点,形成动态趋势线。当RSI突破高点趋势线时开多,突破低点趋势线时开空。 2. 入场时机识别:使用三根K线的RSI值比较来确认局部高点和低点,提高趋势线的准确性。 3. 风险管理机制:采用前一根K线的最低价作为多头止损,最高价作为空头止损,确保有明确的风险控制。 4. 收益优化设计:使用1:4的风险收益比设定止盈位置,在控制风险的同时追求更大的盈利空间。
策略优势
- 系统化决策:通过程序化的RSI趋势线识别和突破判断,避免主观偏见。
- 风险控制严格:使用近期价格波动设定止损,控制每次交易的最大风险。
- 盈亏比优化:固定的1:4风险收益比设置,提高了策略的期望收益。
- 趋势跟踪特性:能够有效捕捉中长期趋势,提高盈利机会。
- 适应性强:可以应用于不同的市场和时间周期。
策略风险
- 假突破风险:RSI突破后可能出现假突破,导致止损出场。
- 止盈距离过远:1:4的风险收益比可能导致止盈位置难以到达。
- 震荡市场表现:在横盘震荡市场中可能频繁触发假信号。
- 滑点影响:在流动性较差的市场中,实际止损价格可能与预期有差异。
策略优化方向
- 动态风险收益比:可根据市场波动性动态调整风险收益比。
- 趋势确认:增加趋势确认指标,如移动平均线或ATR指标。
- 仓位管理:引入基于波动率的仓位管理系统。
- 出场优化:增加移动止损或分批止盈机制。
- 时间过滤:添加交易时间段过滤,避开低流动性期间。
总结
该策略通过结合RSI突破和固定风险收益比,构建了一个完整的趋势跟踪交易系统。策略的优势在于系统化的决策流程和严格的风险控制,但在实际应用中需要注意假突破和市场环境的影响。通过建议的优化方向,策略有望在不同市场环境下取得更稳定的表现。
策略源码
/*backtest
start: 2024-02-19 00:00:00
end: 2025-02-17 08:00:00
period: 2d
basePeriod: 2d
exchanges: [{"eid":"Futures_Binance","currency":"BTC_USDT"}]
*/

// This Pine Script™ code is subject to the terms of the Mozilla Public License 2.0 at https://mozilla.org/MPL/2.0/
// © Sunnysun7771

//@version=6
//@version=5
strategy("RSI Breakout Strategy with RR 1:4", overlay=true)

// Input parameters
rsi_length = input(14, title="RSI Length")
rsi_overbought = input(70, title="RSI Overbought Level")
rsi_oversold = input(30, title="RSI Oversold Level")

// Calculate RSI
rsi_value = ta.rsi(close, rsi_length)

// Identify previous RSI highs and lows
var float rsi_prev_high = na
var float rsi_prev_low = na

// Update previous RSI high
if (rsi_value > rsi_value[1] and rsi_value[1] < rsi_value[2])
    rsi_prev_high := rsi_value[1]

// Update previous RSI low
if (rsi_value < rsi_value[1] and rsi_value[1] > rsi_value[2])
    rsi_prev_low := rsi_value[1]

// Conditions for entering a long position
long_condition = rsi_value > rsi_prev_high and not na(rsi_prev_high)

// Conditions for entering a short position
short_condition = rsi_value < rsi_prev_low and not na(rsi_prev_low)

// Calculate stop loss and take profit for long positions
long_stop_loss = low[1]  // Previous candle's low
long_take_profit = close + (4 * (close - long_stop_loss))  // RR 1:4

// Enter long position if all conditions are met
if (long_condition)
    strategy.entry("Long", strategy.long)
    strategy.exit("Take Profit/Stop Loss", from_entry="Long", stop=long_stop_loss, limit=long_take_profit)

// Calculate stop loss and take profit for short positions
short_stop_loss = high[1]  // Previous candle's high
short_take_profit = close - (4 * (short_stop_loss - close))  // RR 1:4

// Enter short position if all conditions are met
if (short_condition)
    strategy.entry("Short", strategy.short)
    strategy.exit("Take Profit/Stop Loss", from_entry="Short", stop=short_stop_loss, limit=short_take_profit)

// Plotting RSI for visualization
hline(rsi_overbought, "Overbought", color=color.red)
hline(rsi_oversold, "Oversold", color=color.green)
plot(rsi_value, color=color.purple, title="RSI")
相关推荐