
概述
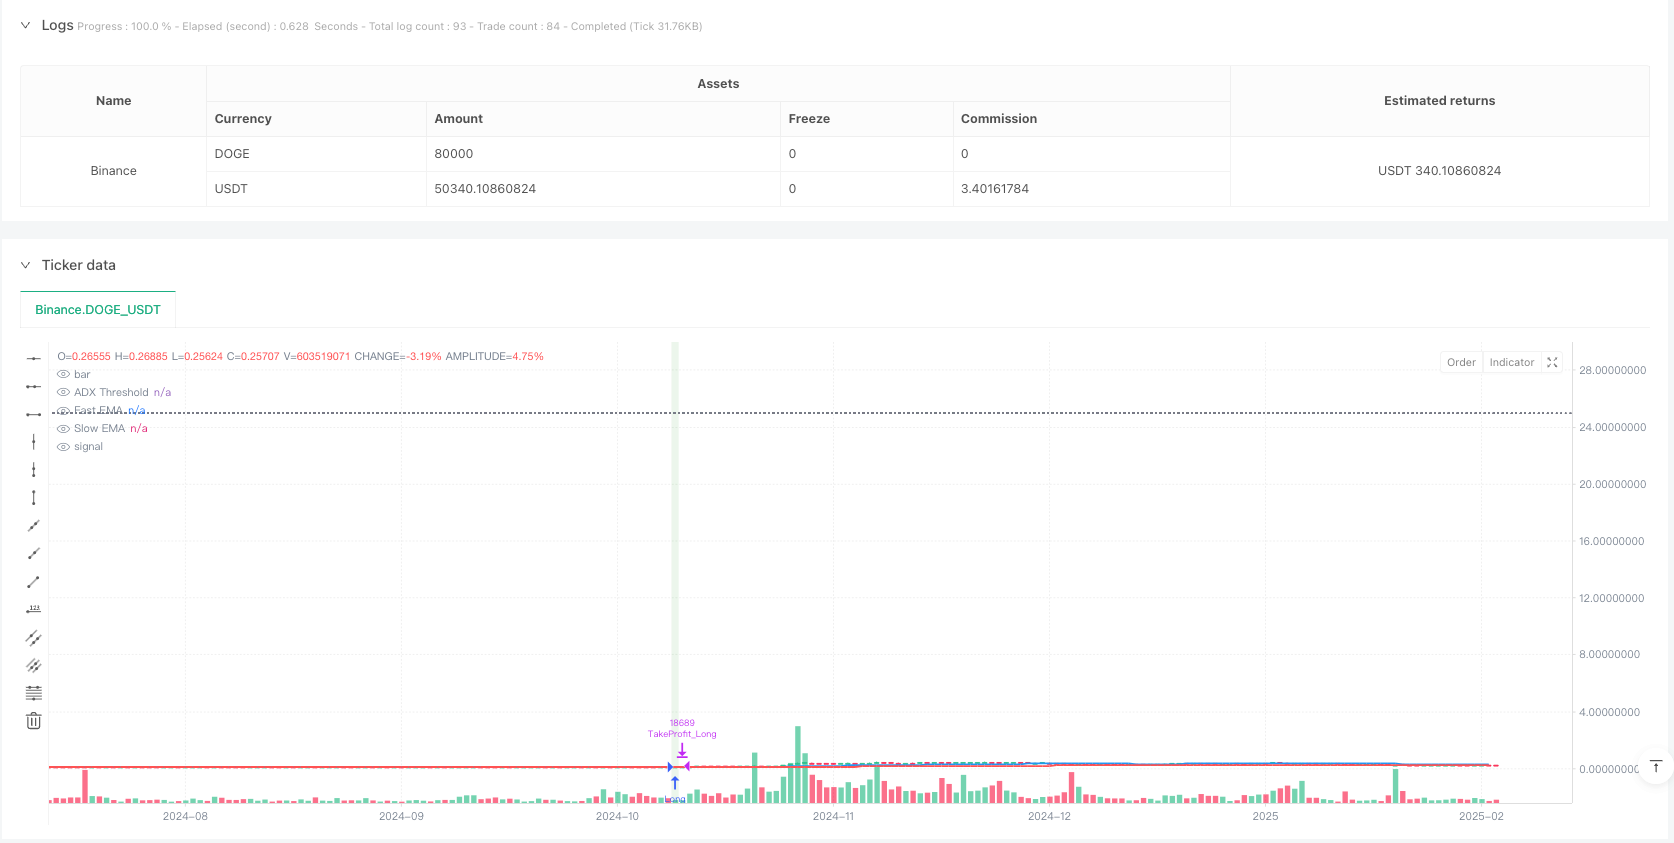
本策略是一个结合了多重时间框架分析的趋势跟踪交易系统,通过整合指数移动平均线(EMA)、平均趋向指数(ADX)和相对强弱指数(RSI)等多个技术指标,在15分钟时间框架上进行交易。策略采用保守的仓位管理方法,每笔交易风险控制在账户总额的2%以内,以实现长期稳定的收益。
策略原理
策略使用快速EMA(50周期)和慢速EMA(200周期)的交叉来识别趋势方向,并结合ADX指标来确认趋势强度。当ADX数值大于25时,表明市场处于强趋势状态。RSI指标用于识别超买超卖状态,在RSI值达到70时平仓多头,RSI值达到30时平仓空头。同时,策略还引入了4小时时间框架的EMA指标作为更高层面的趋势确认,以提高交易的准确性。
策略优势
- 多重技术指标的整合降低了虚假信号的影响,提高了交易的可靠性。
- 采用动态止盈止损设置,可以根据市场波动灵活调整。
- 保守的仓位管理策略(2%风险控制)有效降低了回撤风险。
- 多重时间框架分析提供了更全面的市场趋势视角。
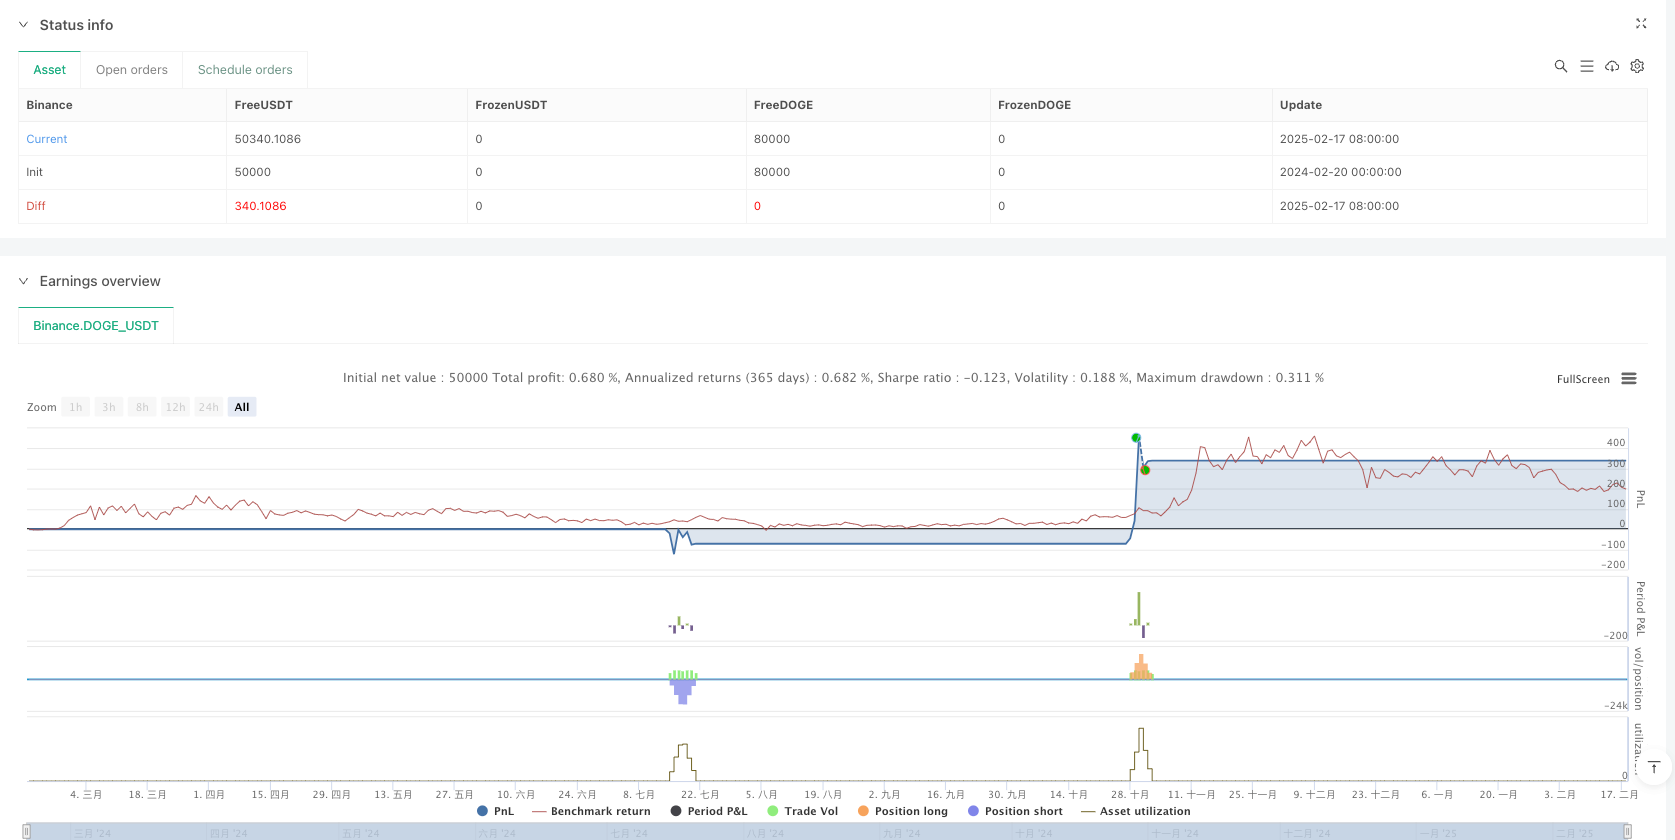
- 策略回测显示有62.86%的胜率,利润因子为1.136。
策略风险
- 在震荡市场中可能产生频繁的交易信号,增加交易成本。
- EMA交叉策略在快速反转行情中可能反应滞后。
- 过度依赖技术指标可能忽视基本面因素的影响。
- 固定的ADX阈值可能在不同市场环境下表现不一致。
策略优化方向
- 引入波动率指标(如ATR)来动态调整止盈止损水平。
- 考虑加入成交量指标作为交易信号的补充确认。
- 开发自适应的ADX阈值系统,以适应不同的市场环境。
- 增加市场情绪指标来提高入场时机的准确性。
- 优化多重时间框架的周期选择,寻找最优组合。
总结
该策略通过多维度的技术分析方法和严格的风险控制,展现出良好的交易潜力。虽然在回测中表现稳定,但仍需要在实盘环境中进行充分验证。策略的模块化设计使其具有较强的适应性和优化空间,可以根据市场变化进行灵活调整。
策略源码
/*backtest
start: 2024-02-20 00:00:00
end: 2025-02-18 00:00:00
period: 1d
basePeriod: 1d
exchanges: [{"eid":"Binance","currency":"DOGE_USDT"}]
*/

//@version=5
strategy("DOGE Enhanced Trend Following Strategy",
         overlay=true,
         default_qty_type=strategy.percent_of_equity,
         default_qty_value=5,
         commission_value=0.1,
         slippage=2)

// === INPUT PARAMETERS ===
emaFastLength = input(50, title="Fast EMA Length")
emaSlowLength = input(200, title="Slow EMA Length")
adxLength = input.int(14, title="ADX Length")
adxSmoothing = input.int(14, title="ADX Smoothing Factor")
adxThreshold = input.float(25, title="ADX Trend Strength Threshold")
rsiLength = input.int(14, title="RSI Length")
rsiOverbought = input.float(70, title="RSI Overbought Level")
rsiOversold = input.float(30, title="RSI Oversold Level")
takeProfitMultiplier = input.float(1.03, title="Take Profit Multiplier", tooltip="Set a dynamic take profit level, e.g., 1.03 = 3% profit")
stopLossMultiplier = input.float(0.97, title="Stop Loss Multiplier", tooltip="Set stop loss level, e.g., 0.97 = 3% below entry price")

// === INDICATOR CALCULATIONS ===
emaFast = ta.ema(close, emaFastLength)
emaSlow = ta.ema(close, emaSlowLength)
[dip, dim, adxValue] = ta.dmi(adxLength, adxSmoothing)
rsiValue = ta.rsi(close, rsiLength)

// === MULTI-TIMEFRAME CONFIRMATION ===
emaFastHTF = request.security(syminfo.tickerid, "240", ta.ema(close, emaFastLength))
emaSlowHTF = request.security(syminfo.tickerid, "240", ta.ema(close, emaSlowLength))

// === CONDITIONS FOR TRADE ENTRY ===
bullishTrend = ta.crossover(emaFast, emaSlow) and adxValue > adxThreshold and rsiValue > rsiOversold
bearishTrend = ta.crossunder(emaFast, emaSlow) and adxValue > adxThreshold and rsiValue < rsiOverbought

// === TRADE EXECUTION ===
if (bullishTrend)
    strategy.entry("Long", strategy.long)
    strategy.exit("TakeProfit_Long", from_entry="Long", limit=close * takeProfitMultiplier, stop=close * stopLossMultiplier)

if (bearishTrend)
    strategy.entry("Short", strategy.short)
    strategy.exit("TakeProfit_Short", from_entry="Short", limit=close * (2 - takeProfitMultiplier), stop=close * (2 - stopLossMultiplier))

// === VISUAL INDICATORS AND PLOTTING ===
plot(emaFast, color=color.blue, linewidth=2, title="Fast EMA")
plot(emaSlow, color=color.red, linewidth=2, title="Slow EMA")
hline(adxThreshold, "ADX Threshold", color=color.gray, linestyle=hline.style_dotted)

bgcolor(bullishTrend ? color.new(color.green, 85) : bearishTrend ? color.new(color.red, 85) : na)

// === ALERTS ===
alertcondition(bullishTrend, title="Buy Signal", message="Bullish trend detected. Consider entering a long position.")
alertcondition(bearishTrend, title="Sell Signal", message="Bearish trend detected. Consider entering a short position.")

// === STRATEGY SETTINGS FOR REALISTIC TESTING ===
strategy.close("Long", when=rsiValue > rsiOverbought, comment="Exit Long on RSI Overbought")
strategy.close("Short", when=rsiValue < rsiOversold, comment="Exit Short on RSI Oversold")
相关推荐