
Overview
This is a high-frequency trading strategy system that combines Bollinger Bands, Moving Average Convergence Divergence (MACD), and volume analysis. The strategy captures market reversal opportunities by identifying price breakouts and reversals at Bollinger Bands, confirmed by MACD momentum indicators and volume analysis. The system implements a daily trade limit and comprehensive risk management mechanisms.
Strategy Principles
The strategy is based on three core indicator combinations:
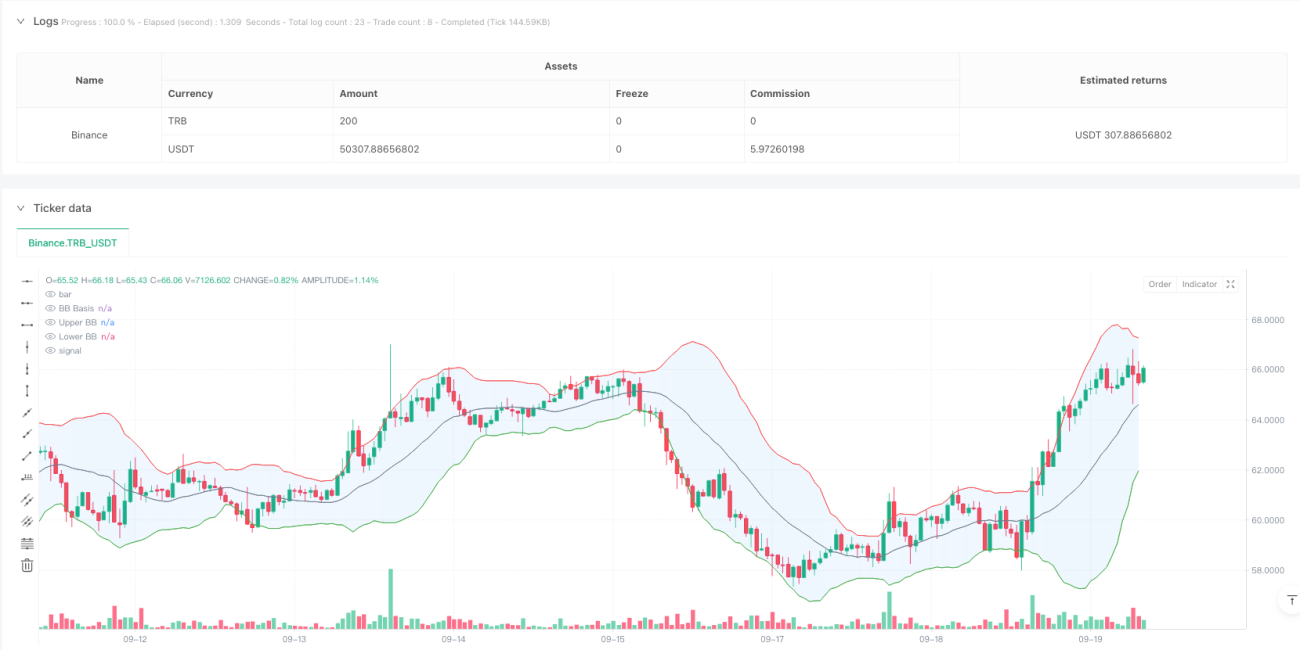
- Bollinger Bands: Uses a 20-period Simple Moving Average (SMA) as the middle band, with a standard deviation multiplier of 2.0 for upper and lower bands. Trading signals are generated when prices revert after breaking the bands.
- MACD Indicator: Employs standard parameters (12,26,9) to confirm price momentum. Bullish signals are confirmed when the MACD line is above the signal line, and bearish signals when below.
- Volume Analysis: Uses a 20-period moving average to confirm volume, requiring signal-bar volume to reach at least the average level to ensure market participation.
Strategy Advantages
- Multiple Signal Confirmation: Triple verification through Bollinger Bands, MACD, and volume significantly improves signal reliability.
- Visual Design: The system provides rich chart indicators, including Bollinger Band fills, signal markers, and background color changes, facilitating quick identification of trading opportunities.
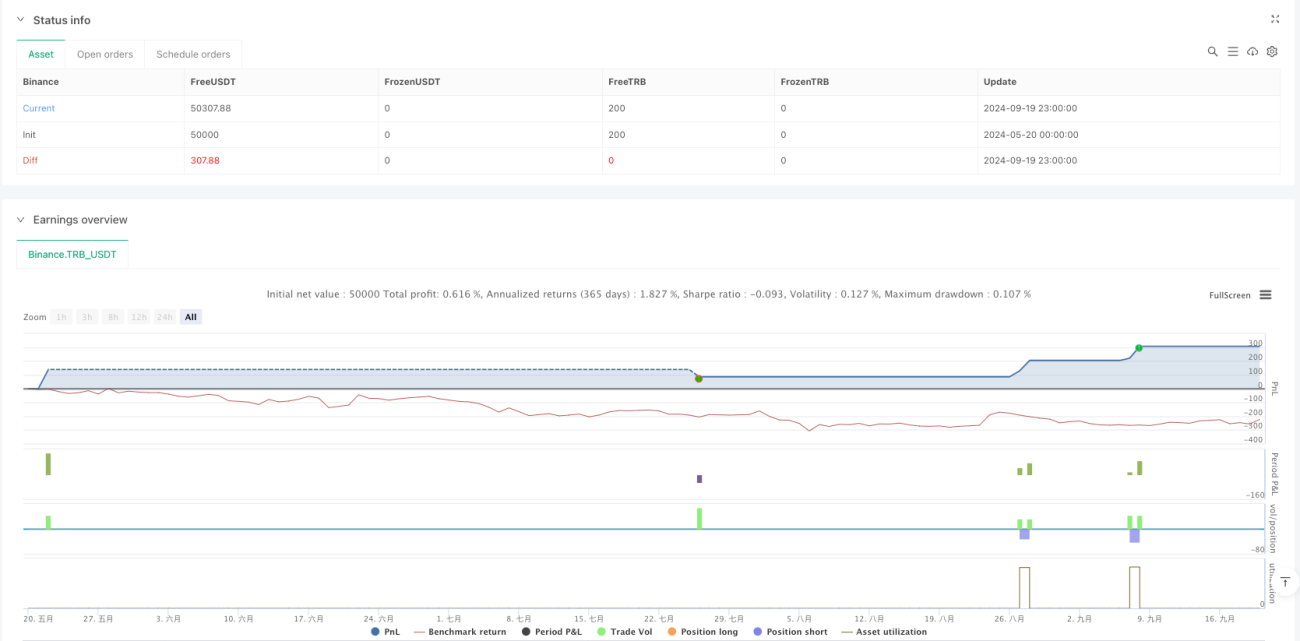
- Comprehensive Risk Control: Implements fixed stop-loss and take-profit targets, with daily trade limits effectively controlling risk exposure.
- Systematic Operation: The strategy provides clear entry and exit conditions, reducing uncertainty from subjective judgment.
Strategy Risks
- Market Volatility Risk: False breakout signals may occur in highly volatile markets, leading to trading losses.
- Slippage Risk: High-frequency trading environments may face significant slippage costs, affecting actual returns.
- Liquidity Risk: Volume conditions may limit trading opportunities during periods of insufficient market liquidity.
- Systematic Risk: Fixed parameter settings may not adapt to dramatic changes in market conditions.
Strategy Optimization Directions
- Dynamic Parameter Optimization: Introduce adaptive parameter adjustment mechanisms to automatically adjust Bollinger Bands and MACD parameters based on market conditions.
- Market Cycle Recognition: Add market cycle identification modules to employ different trading strategies under different market cycles.
- Risk Management Enhancement: Consider implementing dynamic stop-loss mechanisms that adjust stop positions based on market volatility.
- Signal Filter Enhancement: Add trend strength filters to avoid excessive trading signals in ranging markets.
Summary
The strategy constructs a complete trading system through the combination of Bollinger Band reversal signals, MACD trend confirmation, and volume verification. The system's visual design and strict risk control make it particularly suitable for intraday trading. While certain market risks exist, continuous optimization and parameter adjustment enable the strategy to maintain stable performance across different market environments.
- 1