概述
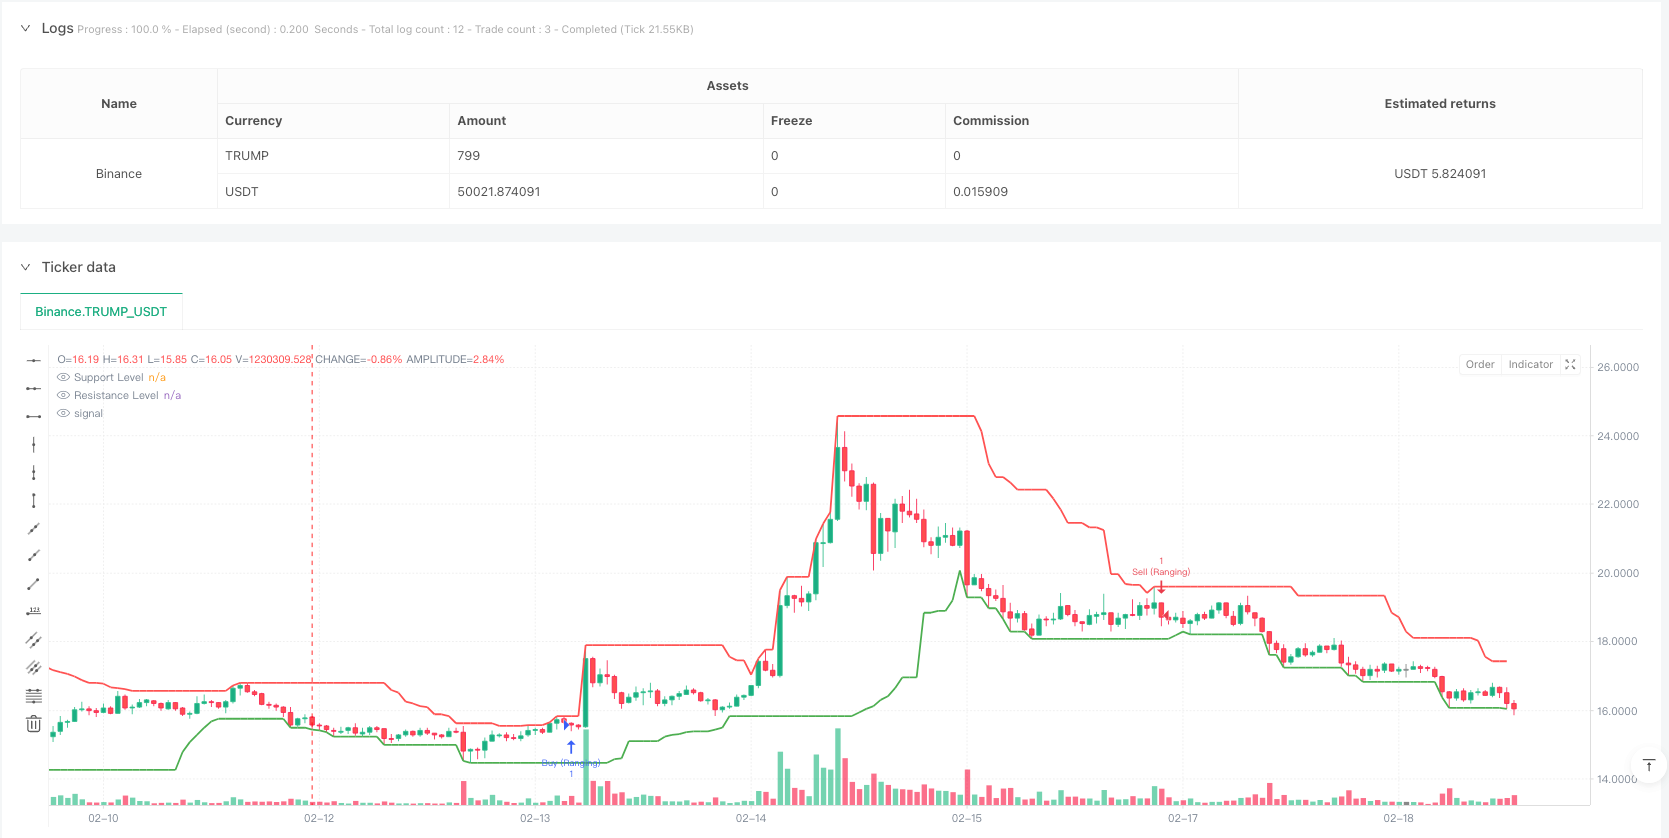
该策略是一个基于技术分析的综合交易系统,结合了支撑阻力区域、蜡烛图形态和市场结构分析。策略通过识别关键价格水平、确认蜡烛图信号以及评估整体市场趋势来做出交易决策。系统采用了1:3的风险收益比,通过预设的止损和获利目标来管理风险。
策略原理
策略的核心逻辑基于以下几个关键组成部分: 1. 支撑阻力区域识别 - 使用过去20个周期的最高价和最低价来确定关键价格水平 2. 蜡烛图形态确认 - 包括看涨吞没、看跌吞没、锤子线和流星线等典型形态 3. 市场结构分析 - 通过比较高点和低点序列来判断市场处于上升趋势、下降趋势还是区间震荡 4. 风险管理 - 采用固定止损点数和1:3的风险收益比来设置止盈位置
策略在三种市场环境下均可运作:趋势市场、区间市场和转折市场,但对每种环境采用了不同的交易规则组合。
策略优势
- 多维度分析 - 通过整合价格水平、蜡烛图形态和市场结构,提供了更可靠的交易信号
- 自适应性强 - 能够适应不同的市场环境,包括趋势和区间
- 风险管理完善 - 采用固定的风险收益比,确保每笔交易都有明确的风险控制
- 可视化支持 - 通过图形标记支撑阻力区域,便于交易者理解市场状态
策略风险
- 假突破风险 - 价格可能在突破后迅速回撤,产生假信号
- 滑点风险 - 在波动剧烈时期,实际成交价格可能与预期有较大偏差
- 参数敏感性 - 支撑阻力周期、市场结构周期等参数的选择会显著影响策略表现
- 市场环境依赖 - 在快速单向行情或者剧烈震荡市场中可能表现欠佳
策略优化方向
- 动态参数调整 - 根据市场波动率自动调整支撑阻力区域的计算周期
- 过滤器增强 - 添加成交量、波动率等指标来过滤假突破信号
- 止损优化 - 实现基于ATR的动态止损设置,提高对市场波动的适应性
- 分时框架验证 - 引入多时间框架分析,提高信号的可靠性
- 仓位管理优化 - 基于市场波动性和信号强度来动态调整持仓规模
总结
该策略通过综合运用多个技术分析工具,构建了一个完整的交易系统。其优势在于多维度分析和完善的风险管理,但同时也面临假突破和参数敏感性等挑战。通过建议的优化方向,策略有望在保持现有优势的基础上进一步提升稳定性和适应性。要成功应用该策略,交易者需要深入理解各个组成部分,并根据实际市场情况进行适当的参数调整。
策略源码
/*backtest
start: 2025-02-12 00:00:00
end: 2025-02-19 00:00:00
period: 1h
basePeriod: 1h
exchanges: [{"eid":"Binance","currency":"TRUMP_USDT"}]
*/

//@version=5
strategy("Support/Resistance Strategy with Candlestick Confirmation, Market Structure, and 1:3 R:R", overlay=true)

// Input parameters
supportResistancePeriod = input.int(20, title="Support/Resistance Period", minval=1)
stopLossPips = input.int(50, title="Stop Loss (in pips)", minval=1)
takeProfitRatio = input.float(3.0, title="Risk-to-Reward Ratio", minval=1.0)
structurePeriod = input.int(20, title="Market Structure Period", minval=1)  // Period to determine market structure

// Function to calculate support level (lowest low in the period)
getSupportLevel() =>
    ta.lowest(low, supportResistancePeriod)

// Function to calculate resistance level (highest high in the period)
getResistanceLevel() =>
    ta.highest(high, supportResistancePeriod)

// Get the support and resistance levels
supportLevel = getSupportLevel()
resistanceLevel = getResistanceLevel()

// Function to detect market structure
isBullishTrend() =>
    high[structurePeriod] > high[structurePeriod+1] and low[structurePeriod] > low[structurePeriod+1]

isBearishTrend() =>
    high[structurePeriod] < high[structurePeriod+1] and low[structurePeriod] < low[structurePeriod+1]

isRanging() =>
    not isBullishTrend() and not isBearishTrend()

// Candlestick Pattern Detection Functions
isBullishEngulfing() =>
    close[1] < open[1] and close > open and close > open[1] and open < close[1]

isBearishEngulfing() =>
    close[1] > open[1] and close < open and close < open[1] and open > close[1]

isDoji() =>
    math.abs(close - open) <= (high - low) * 0.1

isHammer() =>
    body = math.abs(close - open)
    upperShadow = high - math.max(close, open)
    lowerShadow = math.min(close, open) - low
    body <= (high - low) * 0.3 and lowerShadow > body * 2 and upperShadow <= body * 0.5

isShootingStar() =>
    body = math.abs(close - open)
    upperShadow = high - math.max(close, open)
    lowerShadow = math.min(close, open) - low
    body <= (high - low) * 0.3 and upperShadow > body * 2 and lowerShadow <= body * 0.5

// Conditions for Buy and Sell based on candle close
buyCondition = (isBullishEngulfing() or isHammer()) and close > supportLevel
sellCondition = (isBearishEngulfing() or isShootingStar()) and close < resistanceLevel

// Define buy/sell conditions based on market structure
bullishMarket = isBullishTrend() and buyCondition
bearishMarket = isBearishTrend() and sellCondition
rangingMarket = isRanging() and (buyCondition or sellCondition)

// Calculate the Stop Loss and Take Profit Levels
longStopLoss = supportLevel - (stopLossPips * syminfo.mintick)
shortStopLoss = resistanceLevel + (stopLossPips * syminfo.mintick)

// Calculate R:R based Take Profit Levels
longTakeProfit = close + (math.abs(close - longStopLoss) * takeProfitRatio)
shortTakeProfit = close - (math.abs(close - shortStopLoss) * takeProfitRatio)

// Plotting Support and Resistance Lines
plot(supportLevel, color=color.green, linewidth=2, title="Support Level", style=plot.style_line)
plot(resistanceLevel, color=color.red, linewidth=2, title="Resistance Level", style=plot.style_line)

// Strategy: Buy on Support, Sell on Resistance with candlestick confirmation and market structure
if (bullishMarket)
    strategy.entry("Buy", strategy.long, stop=longStopLoss, limit=longTakeProfit)

if (bearishMarket)
    strategy.entry("Sell", strategy.short, stop=shortStopLoss, limit=shortTakeProfit)

if (rangingMarket)
    if (buyCondition)
        strategy.entry("Buy (Ranging)", strategy.long, stop=longStopLoss, limit=longTakeProfit)
    if (sellCondition)
        strategy.entry("Sell (Ranging)", strategy.short, stop=shortStopLoss, limit=shortTakeProfit)

// Optional: Highlighting the zones for support and resistance
bgcolor(close > resistanceLevel ? color.new(color.red, 90) : na, title="Resistance Zone")
bgcolor(close < supportLevel ? color.new(color.green, 90) : na, title="Support Zone")
相关推荐