
概述
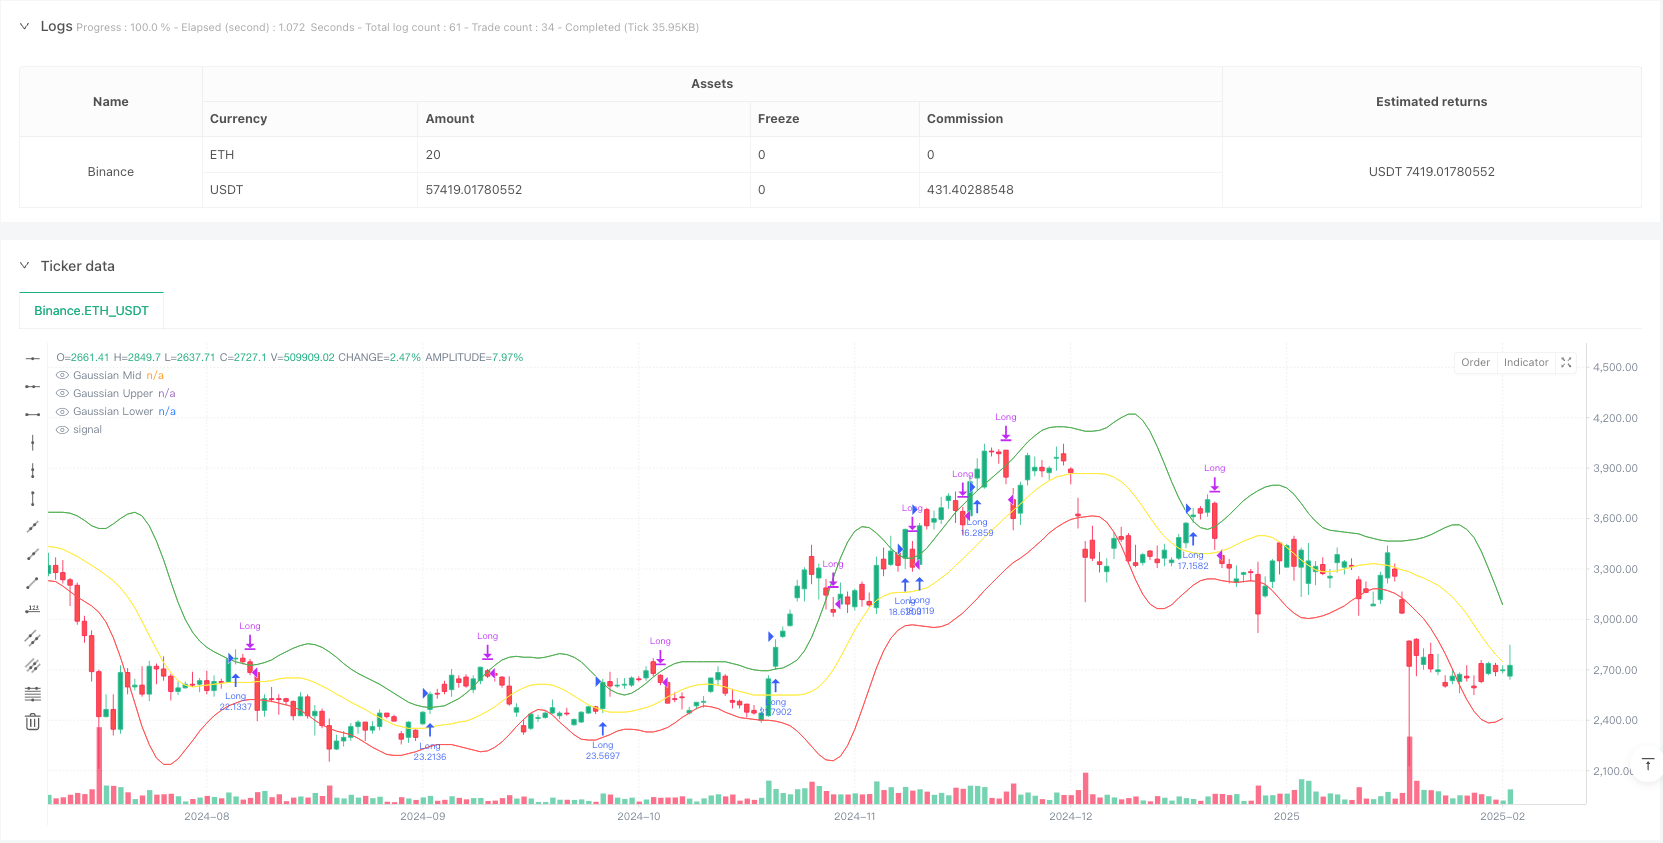
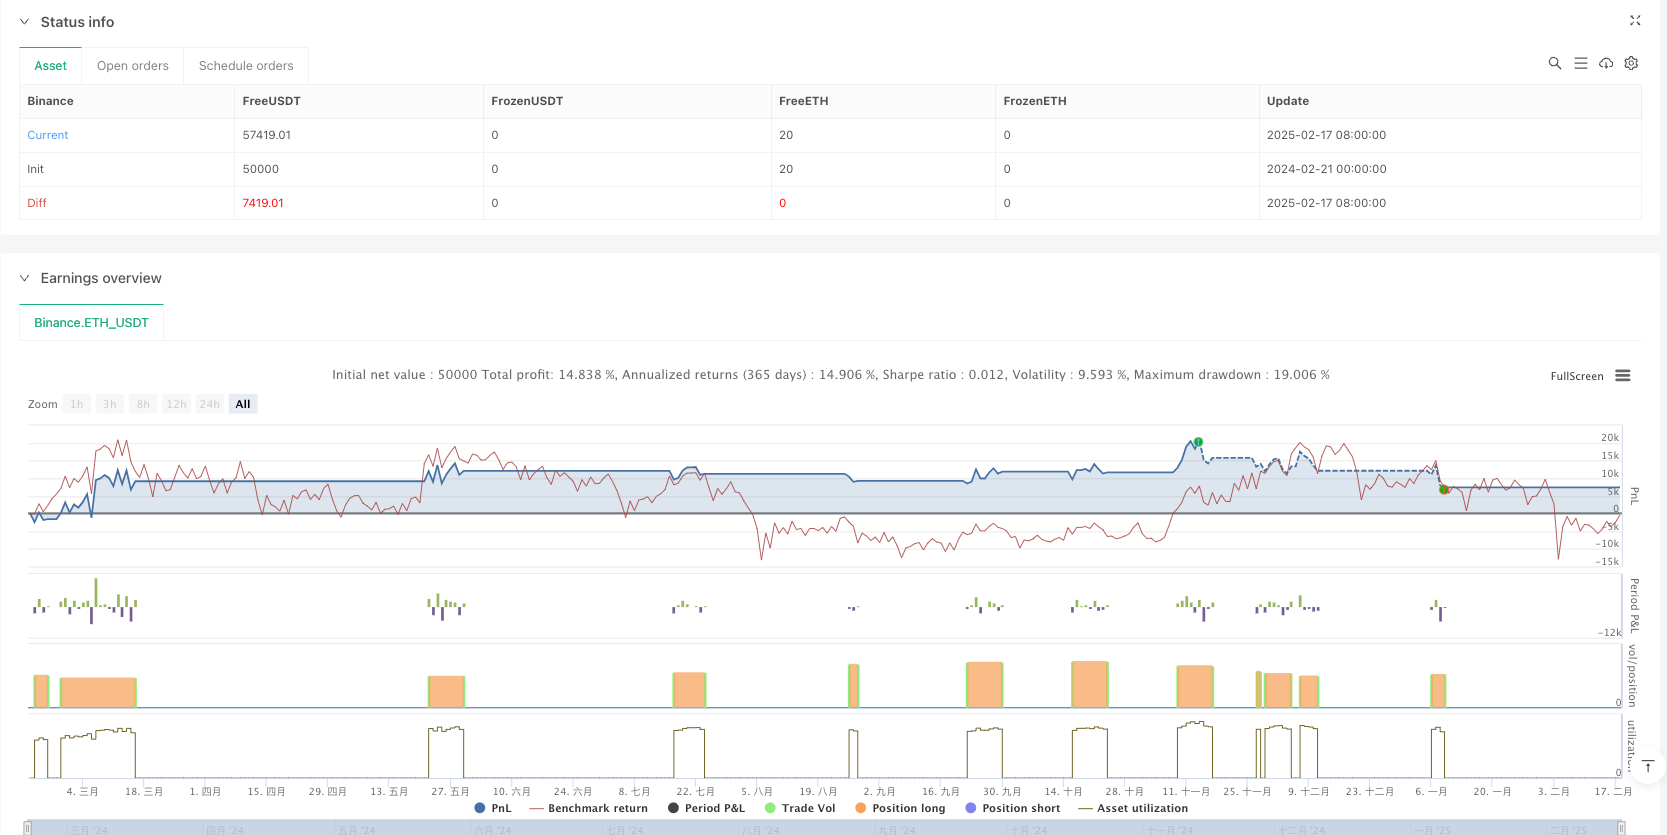
该策略是一个结合了高斯加权移动平均通道和随机相对强弱指数(Stochastic RSI)的趋势跟踪交易系统。策略通过高斯加权方法构建价格通道,并结合随机RSI指标的交叉信号来确定入场和出场时机,实现对趋势的把握和动量的确认。该策略具有良好的数学基础,能够有效地过滤市场噪音,捕捉主要趋势。
策略原理
策略的核心逻辑包含两个主要部分: 1. 高斯通道系统:使用高斯加权移动平均(GWMA)和高斯加权标准差(GWSD)构建价格通道。GWMA赋予近期数据更大的权重,使得均线对价格变化的反应更加敏感。通道上下轨通过将GWSD乘以倍数因子来确定。
- 随机RSI系统:将传统RSI指标进行随机化处理,计算K值和D值。这种处理方式可以更好地识别超买超卖区域,提供更准确的动量信号。
交易信号的产生基于以下条件: - 做多入场:价格收盘价突破高斯通道上轨且随机RSI的K线上穿D线 - 平仓信号:价格收盘价跌破高斯通道上轨
策略优势
- 数学基础扎实:采用高斯加权方法构建价格通道,相比简单移动平均具有更好的理论基础。
- 信号可靠性高:结合价格突破和动量确认的双重验证机制,能够有效降低虚假信号。
- 自适应性强:高斯加权方法能够根据市场波动自动调整通道宽度。
- 风险控制完善:通过资金管理和佣金设置,实现了对交易成本和风险的有效控制。
策略风险
- 趋势依赖性:在震荡市场中可能产生频繁的虚假信号,导致过度交易。
- 滞后性影响:由于使用了多重均线平滑,可能在趋势转折点出现信号滞后。
- 参数敏感性:策略效果受参数设置影响较大,需要仔细优化各项参数。
策略优化方向
- 市场环境识别:添加市场环境判断机制,在不同市场状态下使用不同的参数设置。
- 止损优化:引入动态止损机制,如基于ATR或波动率的自适应止损。
- 信号过滤:增加成交量确认或其他技术指标作为辅助过滤条件。
- 资金管理:实现更灵活的仓位管理策略,根据信号强度动态调整持仓比例。
总结
该策略通过结合高斯通道和随机RSI指标,构建了一个具有扎实数学基础的趋势跟踪系统。策略在趋势明显的市场中表现优异,但需要注意参数优化和市场环境的适应性。通过实施建议的优化措施,可以进一步提升策略的稳定性和盈利能力。
策略源码
/*backtest
start: 2024-02-21 00:00:00
end: 2025-02-18 08:00:00
period: 1d
basePeriod: 1d
exchanges: [{"eid":"Binance","currency":"ETH_USDT"}]
*/

//@version=5
strategy("Gaussian Channel + Stoch RSI Strategy", overlay=true, margin_long=100, margin_short=100, initial_capital=100000, commission_type=strategy.commission.percent, commission_value=0.1, default_qty_type=strategy.percent_of_equity, default_qty_value=100, pyramiding=1)

// User Inputs
length     = input.int(20, "Gaussian Length", minval=5)
multiplier = input.float(2.0, "Channel Multiplier", step=0.1)
rsiLength  = input.int(14, "RSI Length", minval=1)
stochLength= input.int(14, "Stoch RSI Length", minval=1)
kLength    = input.int(3, "Stoch K Smoothing", minval=1)
dLength    = input.int(3, "Stoch D Smoothing", minval=1)

// Gaussian Weighted Moving Average Function
f_gaussian(source, length) =>
    half = (length - 1) / 2.0
    sum = 0.0
    norm = 0.0
    // Gaussian standard deviation chosen as length/6 for a smooth curve
    denom = (length / 6.0) * (length / 6.0)
    for i = 0 to length - 1
        x = i - half
        w = math.exp(-(x * x) / (2 * denom))
        sum += source[i] * w
        norm += w
    sum / norm

// Gaussian Weighted Standard Deviation Function
f_gaussian_std(source, length) =>
    half = (length - 1) / 2.0
    gavg = f_gaussian(source, length)
    sum = 0.0
    norm = 0.0
    denom = (length / 6.0) * (length / 6.0)
    for i = 0 to length - 1
        x = i - half
        w = math.exp(-(x * x)/(2*denom))
        diff = source[i] - gavg
        sum += diff * diff * w
        norm += w
    math.sqrt(sum/norm)

// Compute Gaussian Channel
gaussMid = f_gaussian(close, length)
gaussStd = f_gaussian_std(close, length)
gaussUpper = gaussMid + gaussStd * multiplier
gaussLower = gaussMid - gaussStd * multiplier

// Stochastic RSI Calculation
rsi = ta.rsi(close, rsiLength)
rsiLowest = ta.lowest(rsi, stochLength)
rsiHighest = ta.highest(rsi, stochLength)
stoch = 100 * (rsi - rsiLowest) / math.max(rsiHighest - rsiLowest, 1e-10)
k = ta.sma(stoch, kLength)
d = ta.sma(k, dLength)

// Conditions
// Long entry: Price closes above upper Gaussian line AND Stoch RSI K > D (stochastic is "up")
longCondition = close > gaussUpper and k > d

// Exit condition: Price closes below upper Gaussian line
exitCondition = close < gaussUpper

// Only trade in the specified date range
inDateRange = time >= timestamp("2018-01-01T00:00:00") and time < timestamp("2069-01-01T00:00:00")

// Submit Orders
if inDateRange
    if longCondition and strategy.position_size <= 0
        strategy.entry("Long", strategy.long)
    if exitCondition and strategy.position_size > 0
        strategy.close("Long")

// Plot Gaussian Channel
plot(gaussMid, "Gaussian Mid", color=color.new(color.yellow, 0))
plot(gaussUpper, "Gaussian Upper", color=color.new(color.green, 0))
plot(gaussLower, "Gaussian Lower", color=color.new(color.red, 0))
相关推荐