
Overview
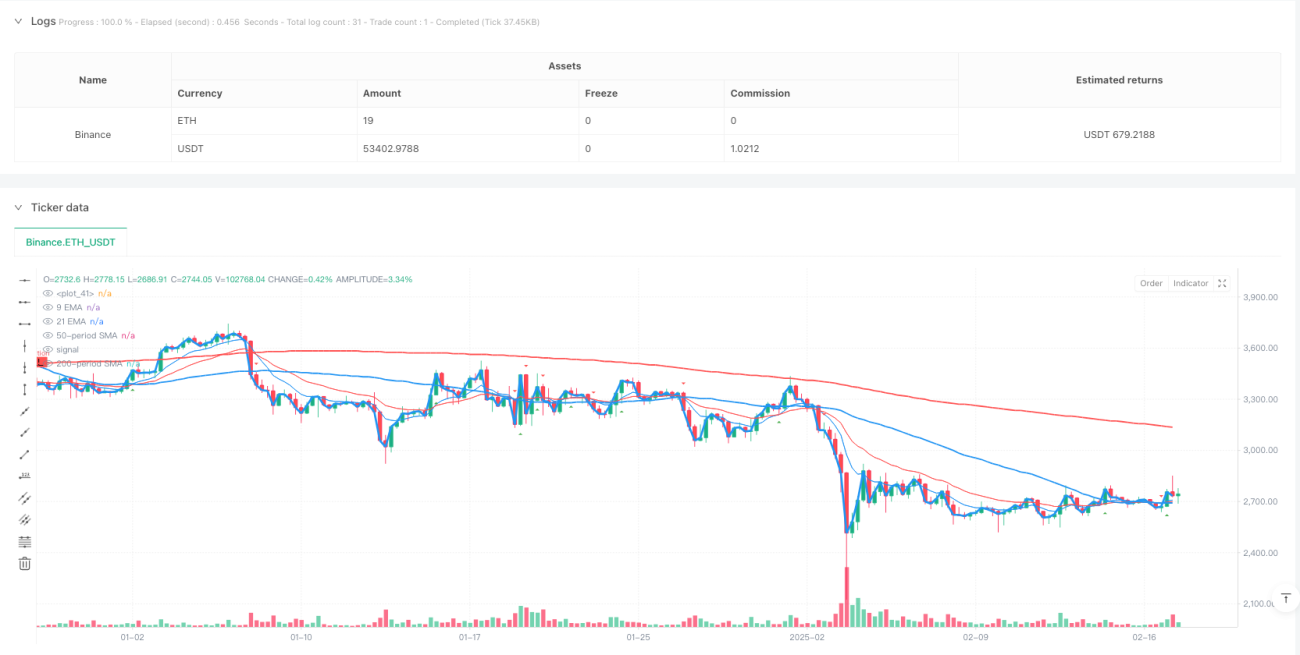
This strategy is a trend reversal trading system based on multiple moving average combinations, incorporating 9-period, 21-period, 50-period, and 200-period moving averages to identify market trend turning points through crossover signals. The strategy integrates the advantages of both short-term and long-term moving averages, enabling timely capture of market momentum changes while effectively filtering false signals.
Strategy Principles
The core logic is built on a multiple timeframe moving average crossover system. Specifically:
- Uses 50-period and 200-period Simple Moving Averages (SMA) as primary trend indicators
- Employs 9-period and 21-period Exponential Moving Averages (EMA) for short-term signal confirmation
- Optimizes signal quality through lookback period and threshold parameters
- Incorporates support and resistance level identification using pivot point algorithms
The system generates buy signals when shorter-term averages cross above longer-term ones, and sell signals when the opposite occurs.
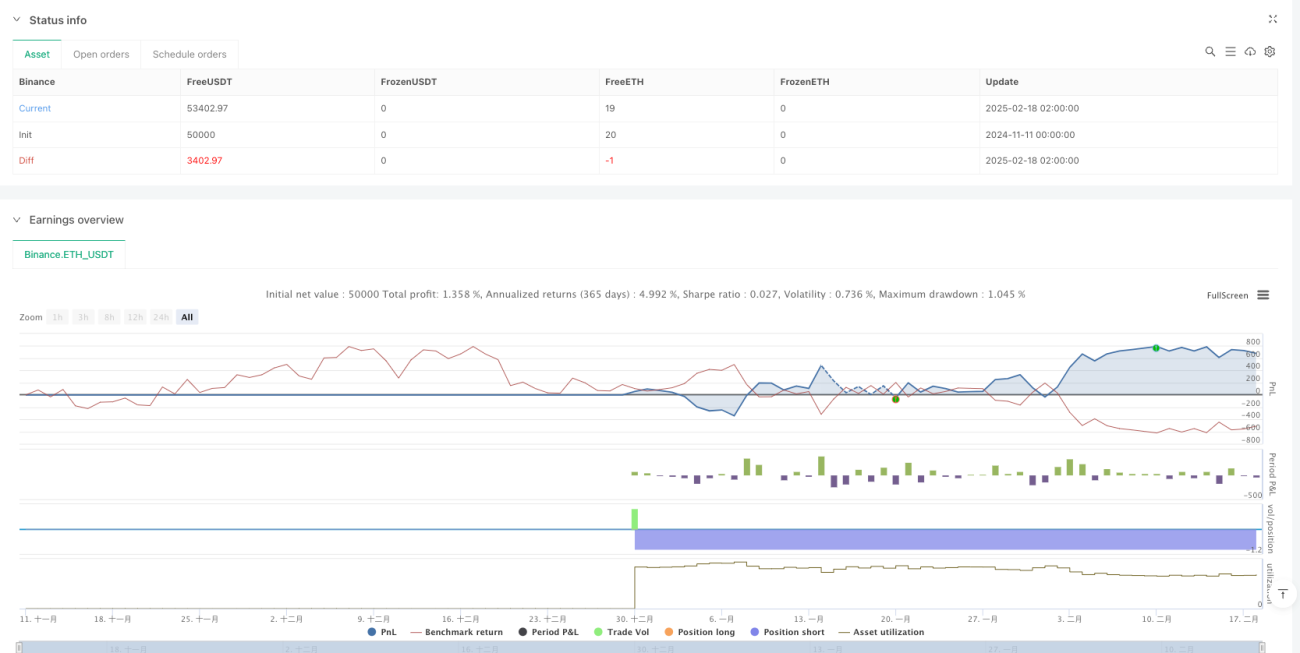
Strategy Advantages
- Signal Reliability: Multiple moving average confirmations significantly reduce false signal risks
- Timely Trend Capture: Short-term averages enable quick response to market changes
- Comprehensive Risk Control: Support and resistance identification aids in stop-loss and take-profit placement
- Parameter Flexibility: Adjustable lookback and threshold parameters for different market conditions
- Intuitive Visualization: Clear graphical interface facilitates trading decisions
Strategy Risks
- Choppy Market Risk: May generate frequent false signals during consolidation phases
- Lag Risk: Moving averages are inherently lagging indicators, potentially missing optimal entry points
- Parameter Sensitivity: Different parameter combinations may lead to varying strategy performance
- Market Environment Dependency: Strategy performs better in trending markets, may underperform during high volatility periods
Strategy Optimization Directions
- Volume Integration: Consider incorporating volume as a signal confirmation indicator
- Signal Filtering Enhancement: Design stricter signal confirmation mechanisms, such as requiring signal persistence
- Dynamic Parameter Adjustment: Develop adaptive parameter systems that automatically adjust based on market conditions
- Risk Control Improvement: Add dynamic stop-loss mechanisms to protect profits
- Market Context Integration: Incorporate volatility indicators to adapt parameters to different market environments
Summary
The strategy effectively identifies market trend turning points through the synergy of multiple moving average systems. The design emphasizes practicality and operability, with flexible parameter adjustment capabilities for different market conditions. While certain limitations exist, continuous optimization and refinement show promising potential for overall strategy performance.
- 1