基于价格区间和突破的高效量化交易策略
Pivot CONSOLIDATION ZONE BREAKOUT
创建日期:
2025-02-20 11:41:51
最后修改:
2025-02-27 17:46:06
复制:
5
点击次数:
528
概述
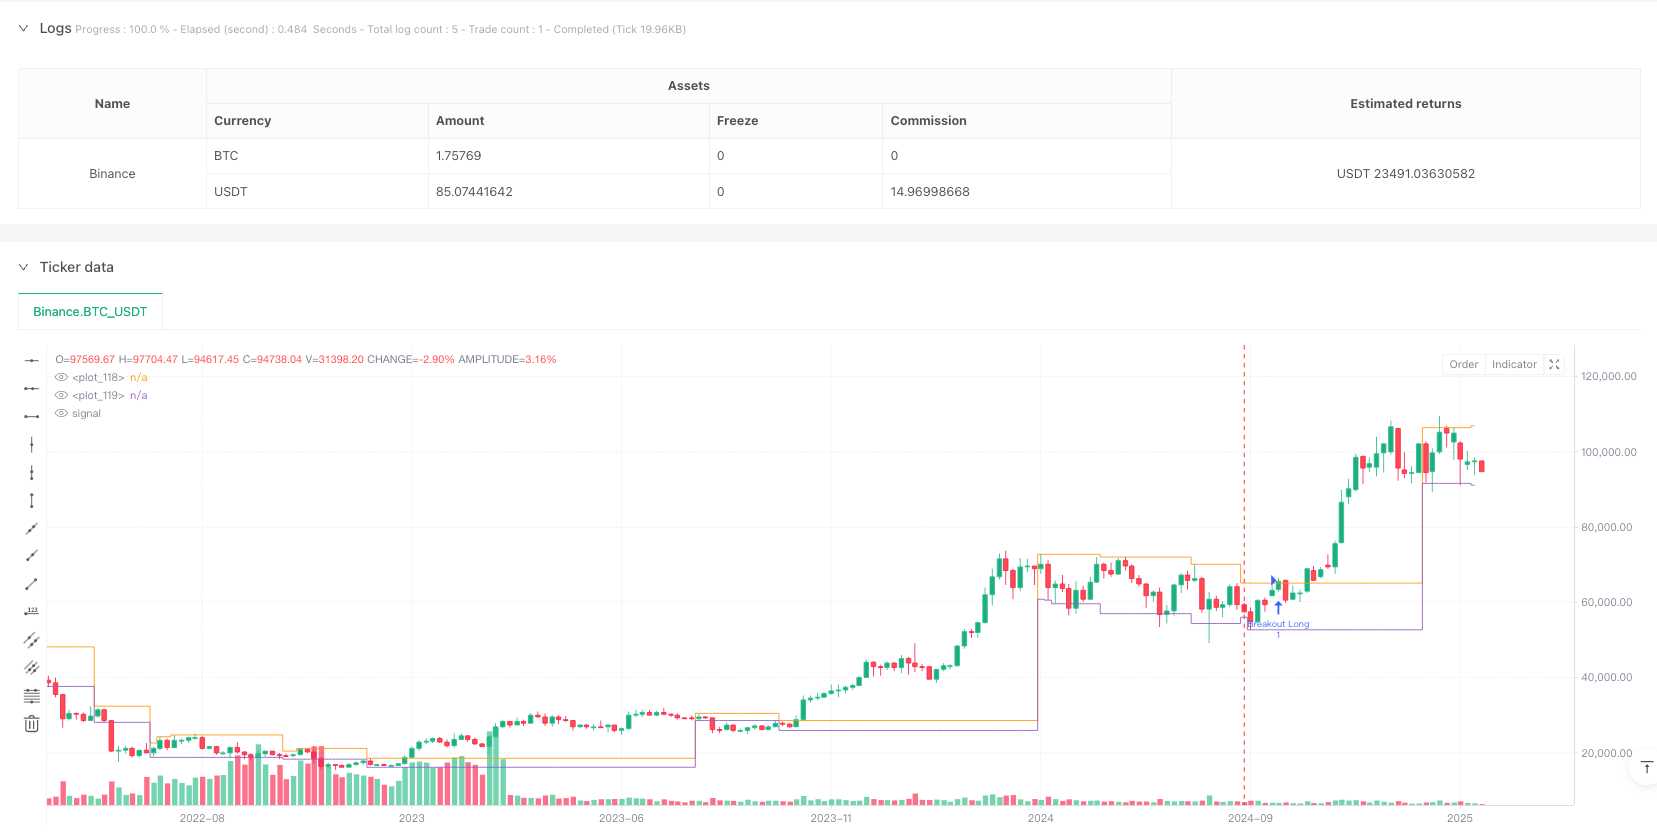
这是一个基于价格区间和突破的高效量化交易策略。该策略主要通过识别市场中的盘整区间,并在价格突破这些区间时进行交易。策略使用ZigZag指标来识别关键价格点,结合高低点定义盘整区域,并在价格突破这些区域时发出交易信号。
策略原理
策略的核心逻辑包括以下几个关键步骤: 1. 通过回溯期间(Loopback Period)内的最高价和最低价点来识别重要的转折点 2. 使用ZigZag算法追踪价格走势,确定关键支撑和阻力位 3. 通过设定最小consolidation长度来确认有效的盘整区间 4. 动态更新上下边界,实时跟踪盘整区域的变化 5. 在价格突破盘整区间时触发交易信号
策略优势
- 适应性强 - 策略能够动态识别和更新盘整区间,适应不同市场环境
- 风险可控 - 通过明确的盘整区间界定,为交易提供清晰的止损位置
- 可视化支持 - 提供盘整区域的可视化展示,便于交易者理解市场状态
- 双向交易 - 支持向上和向下突破的交易机会,最大化市场机会
- 参数可调 - 提供多个可调参数,便于根据不同市场特征进行优化
策略风险
- 假突破风险 - 市场可能出现假突破,导致交易失败
- 滑点风险 - 在快速行情中可能面临较大滑点
- 市场环境依赖 - 策略在震荡市场表现较好,但在趋势市场可能表现欠佳
- 参数敏感性 - 参数设置不当可能影响策略表现
- 资金管理风险 - 需要合理控制每次交易的资金规模
策略优化方向
- 引入成交量指标 - 通过成交量确认突破的有效性
- 优化入场时机 - 增加回调确认机制,提高入场质量
- 完善止损机制 - 设计更灵活的止损策略
- 增加市场环境过滤 - 添加趋势判断,在合适的市场环境下运行
- 优化参数自适应 - 根据市场波动性自动调整参数
总结
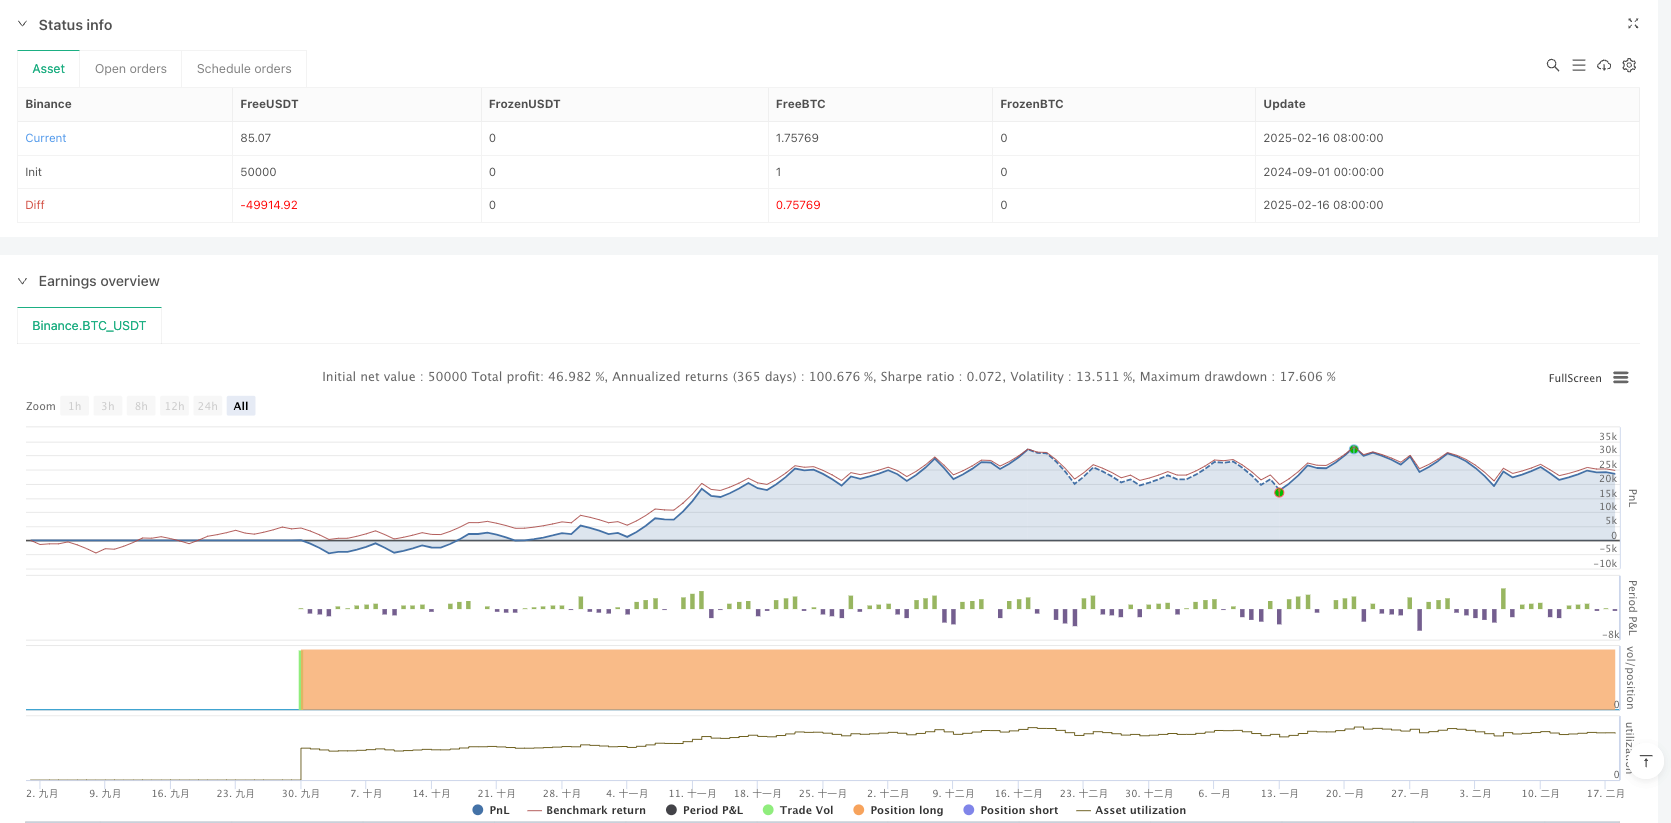
这是一个设计合理、逻辑清晰的量化交易策略。通过对盘整区间的识别和突破信号的捕捉,为交易者提供了一个可靠的交易系统。策略的可视化效果和参数灵活性使其具有较好的实用性。通过持续优化和风险控制,该策略有望在实际交易中取得稳定收益。
策略源码
/*backtest
start: 2024-09-01 00:00:00
end: 2025-02-18 08:00:00
period: 5d
basePeriod: 5d
exchanges: [{"eid":"Binance","currency":"BTC_USDT"}]
*/

// This code is released under the Mozilla Public License 2.0
// More details at: https://mozilla.org/MPL/2.0/
// © LonesomeTheBlue

//@version=5
strategy("Consolidation Zones - Live [Strategy]", overlay=true, max_bars_back=1100)

//-----------------------------------------------------------------------//
//                        Input Variables
//-----------------------------------------------------------------------//
prd       = input.int(defval=10, title="Loopback Period", minval=2, maxval=50)
conslen   = input.int(defval=5,  title="Min. Consolidation Length", minval=2, maxval=20)
paintcons = input.bool(defval=true, title="Color Consolidation Zone?")
zonecol   = input.color(defval=color.new(color.blue, 70), title="Zone Color")

//-----------------------------------------------------------------------//
//                  Variables and Calculations for ZZ (ZigZag) Detection
//-----------------------------------------------------------------------//

// Check if the bar has the highest High or lowest Low in the last prd bars
float hb_ = ta.highestbars(prd) == 0 ? high : na
float lb_ = ta.lowestbars(prd)  == 0 ? low  : na

// Convert to bool to check if hb_ and lb_ are valid (not na)
bool hasHb = not na(hb_)
bool hasLb = not na(lb_)

// Direction variable to determine the trend, based on the last high or low pivot
var int dir = 0

// ZigZag value and last pivot
float zz = na
float pp = na

// 1) Determine direction based on whether a high or low pivot occurred
dir := if hasHb and not hasLb
    1
else if hasLb and not hasHb
    -1
else
    dir  // unchanged direction

// 2) If both a high and low pivot occurred in the same bar
bool sameBar = hasHb and hasLb
if sameBar
    if dir == 1
        zz := hb_
    else
        zz := lb_
else
    zz := hasHb ? hb_ : (hasLb ? lb_ : na)

// 3) Storing last pivots (pp) - iterate over older bars
for x = 0 to 1000
    if na(close) or dir != dir[x]
        break
    if not na(zz[x])  // if zz[x] is a valid value
        if na(pp)
            pp := zz[x]
        else
            if dir[x] == 1 and zz[x] > pp
                pp := zz[x]
            if dir[x] == -1 and zz[x] < pp
                pp := zz[x]

//-----------------------------------------------------------------------//
//                Logic for Consolidation Zone Detection
//-----------------------------------------------------------------------//
var int   conscnt    = 0
var float condhigh   = na
var float condlow    = na

float H_ = ta.highest(conslen)
float L_ = ta.lowest(conslen)

var line upline      = na
var line dnline      = na

bool breakoutup    = false
bool breakoutdown  = false

// Check if pp has changed
bool changedPP = ta.change(pp) != 0

if changedPP
    // If enough candles are in consolidation, check for breakout
    if conscnt > conslen and not na(condhigh) and not na(condlow) and not na(pp)
        if pp > condhigh
            breakoutup := true
        if pp < condlow
            breakoutdown := true

    // Check if we are still "in the zone"
    bool inZone = conscnt > 0 and not na(pp) and not na(condhigh) and not na(condlow) and (pp <= condhigh) and (pp >= condlow)
    if inZone
        conscnt += 1
    else
        conscnt := 0
else
    // No change in pivot -> continue consolidation
    conscnt += 1

if conscnt >= conslen
    // At the first "touch" of the required number of candles
    if conscnt == conslen
        condhigh := H_
        condlow  := L_
    else
        condhigh := math.max(condhigh, high)
        condlow  := math.min(condlow, low)


//-----------------------------------------------------------------------//
//                          Drawing Fill
//-----------------------------------------------------------------------//
// Declare two plot variables (just ordinary assignment)
condHighPlot = plot(condhigh, color=na, style=plot.style_stepline)
condLowPlot  = plot(condlow,  color=na, style=plot.style_stepline)

// bool to check if we want to color the zone
bool doFill = paintcons and (conscnt > conslen)

// Calling fill
fill(condHighPlot, condLowPlot, color= doFill ? zonecol : color.new(color.white, 100))

//-----------------------------------------------------------------------//
//                          Alerts & STRATEGY
//-----------------------------------------------------------------------//
alertcondition(breakoutup,   title="Breakout Up",   message="Breakout Up")
alertcondition(breakoutdown, title="Breakout Down", message="Breakout Down")

if breakoutup
    // Close short first
    if strategy.position_size < 0
        strategy.close("Breakout Short")
    // Open LONG
    strategy.entry("Breakout Long", strategy.long)

if breakoutdown
    // Close long first
    if strategy.position_size > 0
        strategy.close("Breakout Long")
    // Open SHORT
    strategy.entry("Breakout Short", strategy.short)
相关推荐