Dynamic Adaptive Multi-Indicator Crossing Strategy with SRSI-MACD Smart Risk Control System

Overview
This strategy is a dynamic trading system that combines the Stochastic Relative Strength Index (SRSI) and Moving Average Convergence/Divergence (MACD). It implements intelligent risk management through dynamic stop-loss and take-profit levels adjusted by the Average True Range (ATR) indicator. The core of the strategy lies in generating trading signals through multiple technical indicator crossovers while managing positions based on market volatility.
Strategy Principles
The strategy operates based on the following core mechanisms:
- Market trends are determined by calculating the difference between K-line and D-line of SRSI, as well as the difference between K-line and normalized MACD
- Buy conditions require: positive K-D difference, positive K-MACD difference, and MACD not in downtrend
- Sell conditions require: negative K-D difference, negative K-MACD difference, and MACD not in uptrend
- Dynamic calculation of stop-loss and take-profit distances using ATR multiplied by a risk factor, adapting to market volatility
Strategy Advantages
- Multiple signal confirmation mechanism significantly improves trading reliability, avoiding false signals from single indicators
- Dynamic stop-loss and take-profit settings automatically adjust to market volatility, providing better risk-reward ratios
- The strategy demonstrates good adaptability, maintaining stable performance across different market conditions
- Strong parameter adjustability allows traders to optimize according to personal risk preferences
Strategy Risks
- May generate excessive trading signals in ranging markets, leading to frequent market entries and exits
- Multiple indicators might result in delayed signals, missing optimal entry points in rapidly changing markets
- ATR calculations based on historical volatility may not adapt quickly to sudden market volatility changes
- Requires appropriate risk factor settings, as both too high or too low values can affect strategy performance
Strategy Optimization Directions
- Add trend filters to apply different signal confirmation standards in ranging and trending markets
- Incorporate volume indicators as auxiliary confirmation to improve signal reliability
- Optimize stop-loss and take-profit calculations, potentially incorporating support and resistance levels
- Introduce market volatility prediction models for preemptive risk parameter adjustments
- Consider signal confirmation across different timeframes to enhance strategy robustness
Summary
This strategy builds a robust trading system by combining the advantages of SRSI and MACD. Its dynamic risk management mechanism provides good adaptability, though traders still need to optimize parameters based on actual market conditions. Successful strategy implementation requires deep market understanding and appropriate position management aligned with individual risk tolerance.
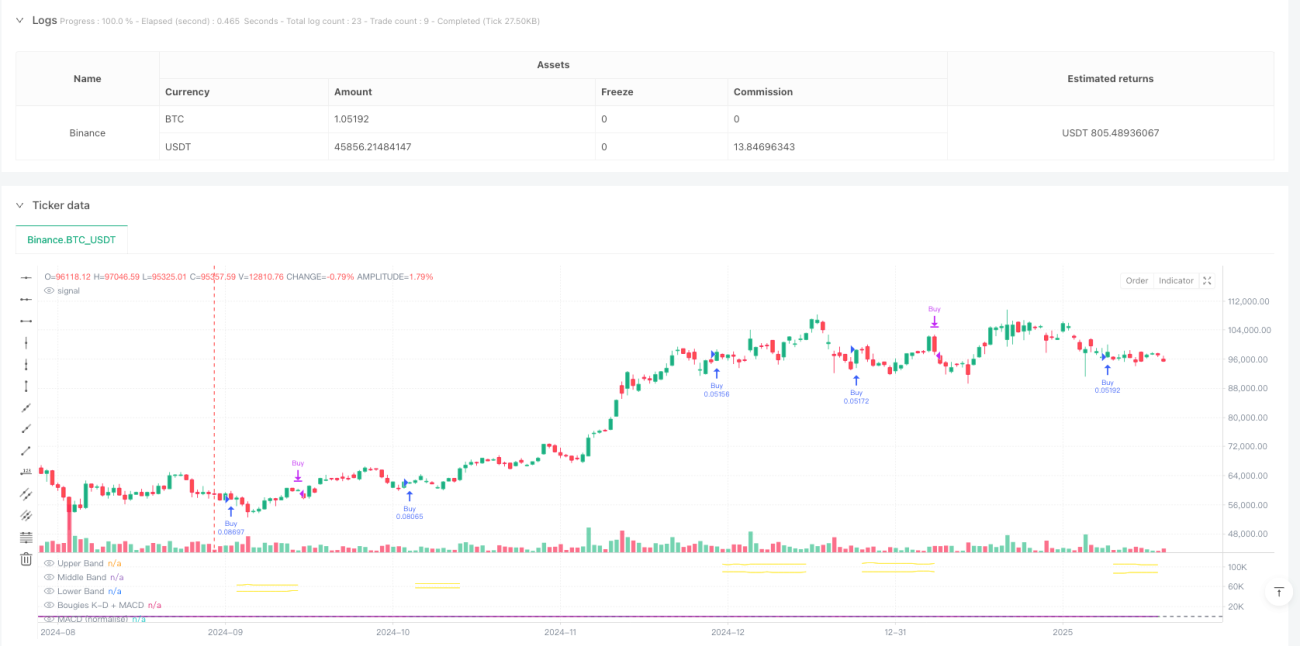
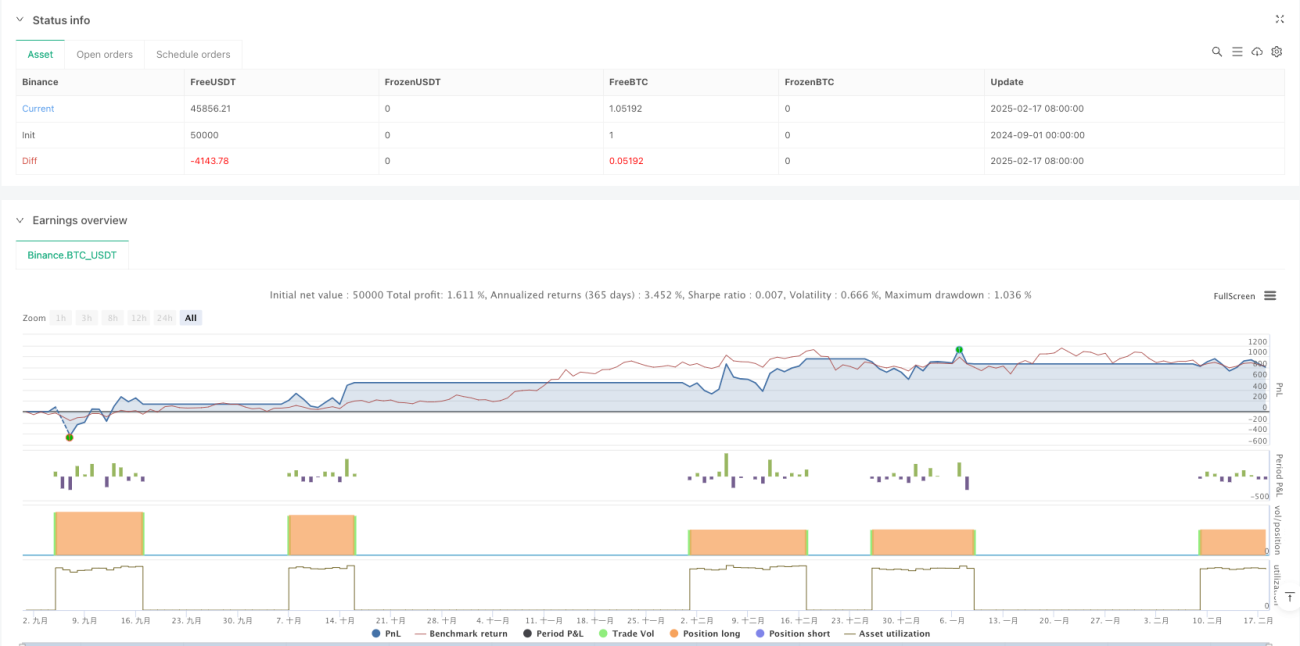
/*backtest
start: 2024-09-01 00:00:00
end: 2025-02-18 08:00:00
period: 1d
basePeriod: 1d
exchanges: [{"eid":"Binance","currency":"BTC_USDT"}]
*/

//@version=6
strategy(title="SRSI + MACD Strategy with Dynamic Stop-Loss and Take-Profit", shorttitle="SRSI + MACD Strategy", overlay=false, default_qty_type=strategy.percent_of_equity, default_qty_value=10)

// User Inputs- 1