ATR Dynamic Trailing Stop Trend Following Trading System

2
Follow
478
Followers
Overview
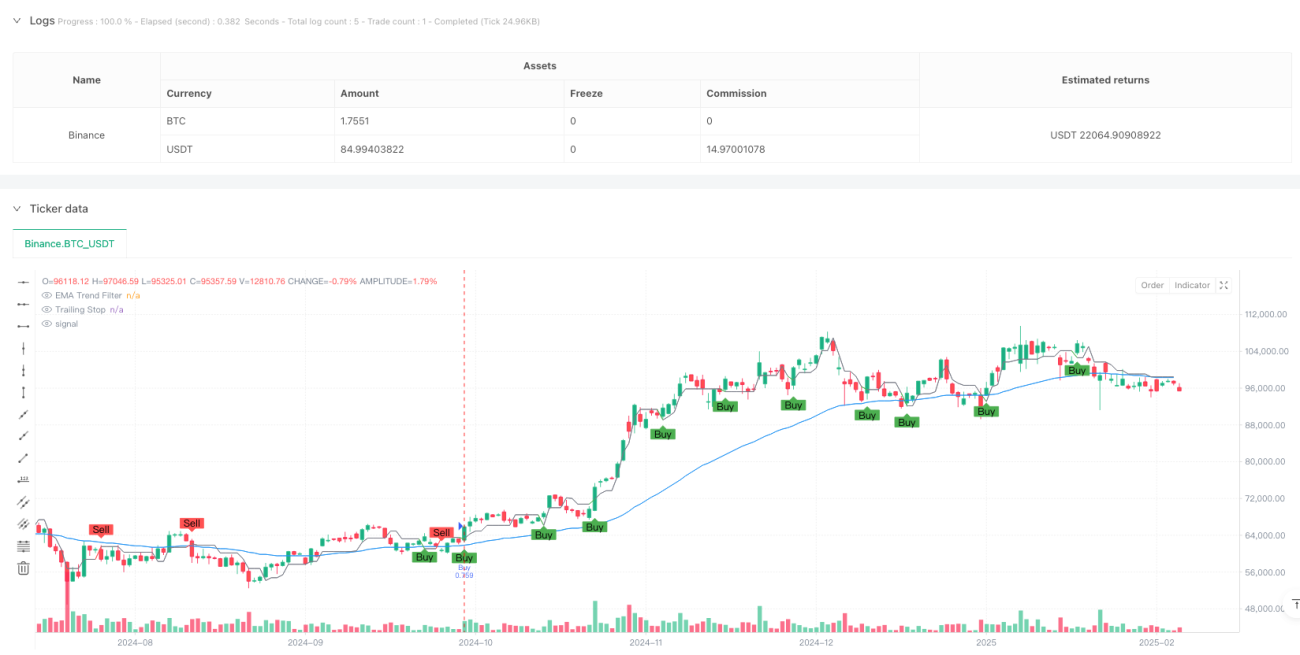
This strategy is a trend following system based on ATR (Average True Range) dynamic trailing stop. It combines EMA as trend filter and controls signal generation through adjustable sensitivity parameters and ATR period. The system supports both long and short trades with comprehensive profit management mechanism.
Strategy Principle
- Uses ATR indicator to calculate price volatility and determines trailing stop distance based on set sensitivity coefficient (Key Value)
- Uses EMA to judge market trend direction, only opening long positions above EMA and short positions below EMA
- Triggers trading signals when price breaks through trailing stop line and aligns with trend direction
- System employs staged profit management:
- At 20%-50% profit, raises stop loss to breakeven
- At 50%-80% profit, takes partial profit and tightens stop loss
- At 80%-100% profit, further tightens stop loss to protect profits
- Above 100% profit, closes entire position
Strategy Advantages
- Dynamic trailing stop effectively follows trends while preventing premature exits
- EMA trend filtering effectively reduces false breakout risks
- Staged profit mechanism ensures profit realization while giving trends room to develop
- Supports both long and short trading, fully capturing market opportunities
- Strong parameter adjustability, adapting to different market environments
Strategy Risks
- May result in losses from frequent trading in ranging markets
- Potentially large drawdowns during trend reversal initiation
- Improper parameter settings may affect strategy performance
Risk control suggestions:
- Recommended use in clear trending markets
- Careful parameter selection through backtesting
- Set maximum drawdown limits
- Consider adding market condition filters
Strategy Optimization Directions
- Add market environment recognition mechanism to use different parameters under different market conditions
- Introduce volume and other auxiliary indicators to enhance signal reliability
- Optimize profit management mechanism with dynamic profit targets based on volatility
- Add time filters to avoid trading during unfavorable periods
- Consider adding volatility filters to reduce trading frequency during excessive volatility
Summary
This is a well-structured trend following system with clear logic. Through the combination of ATR dynamic tracking and EMA trend filtering, it captures trends while maintaining good risk control. The staged profit mechanism design reflects mature trading thinking. The strategy has strong practicality and extensibility, with potential for better trading results through continuous optimization and improvement.
Source
Pine
/*backtest
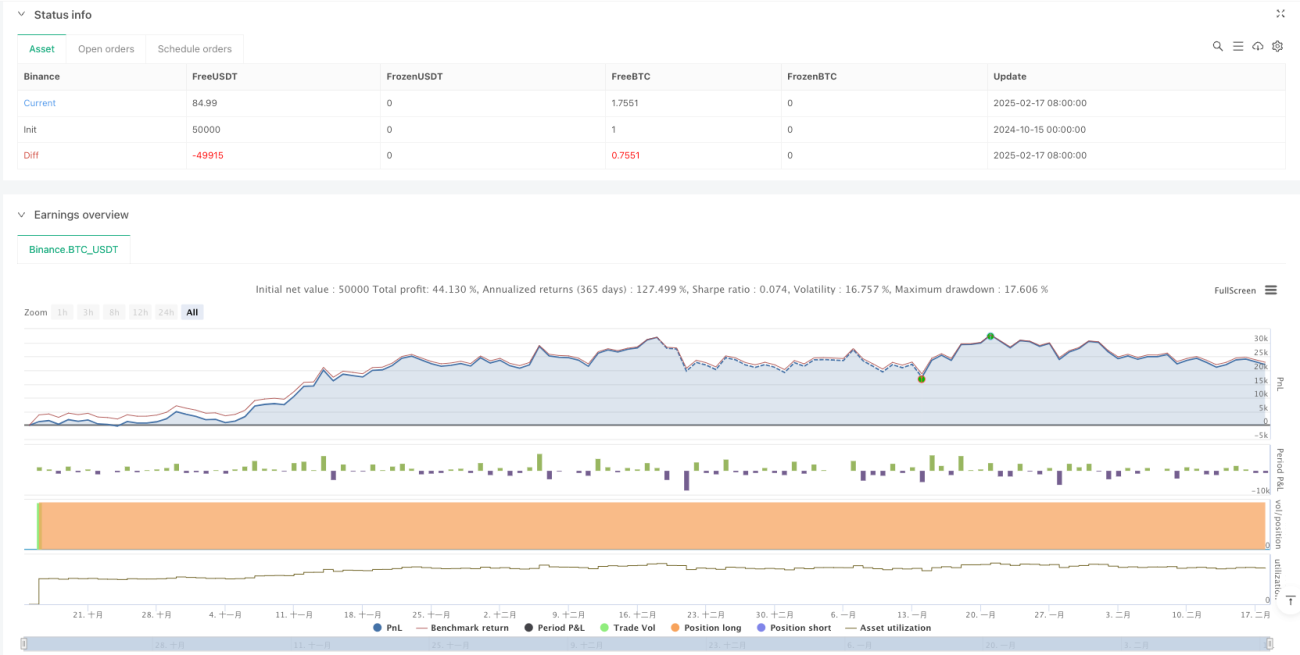
start: 2024-10-15 00:00:00
end: 2025-02-18 08:00:00
period: 1d
basePeriod: 1d
exchanges: [{"eid":"Binance","currency":"BTC_USDT"}]
*/
//@version=5
strategy("Enhanced UT Bot with Long & Short Trades", overlay=true, default_qty_type=strategy.percent_of_equity, default_qty_value=100)
// Input ParametersStrategy parameters
Related strategies
Comment
All comments (0)
No data
- 1