
概述
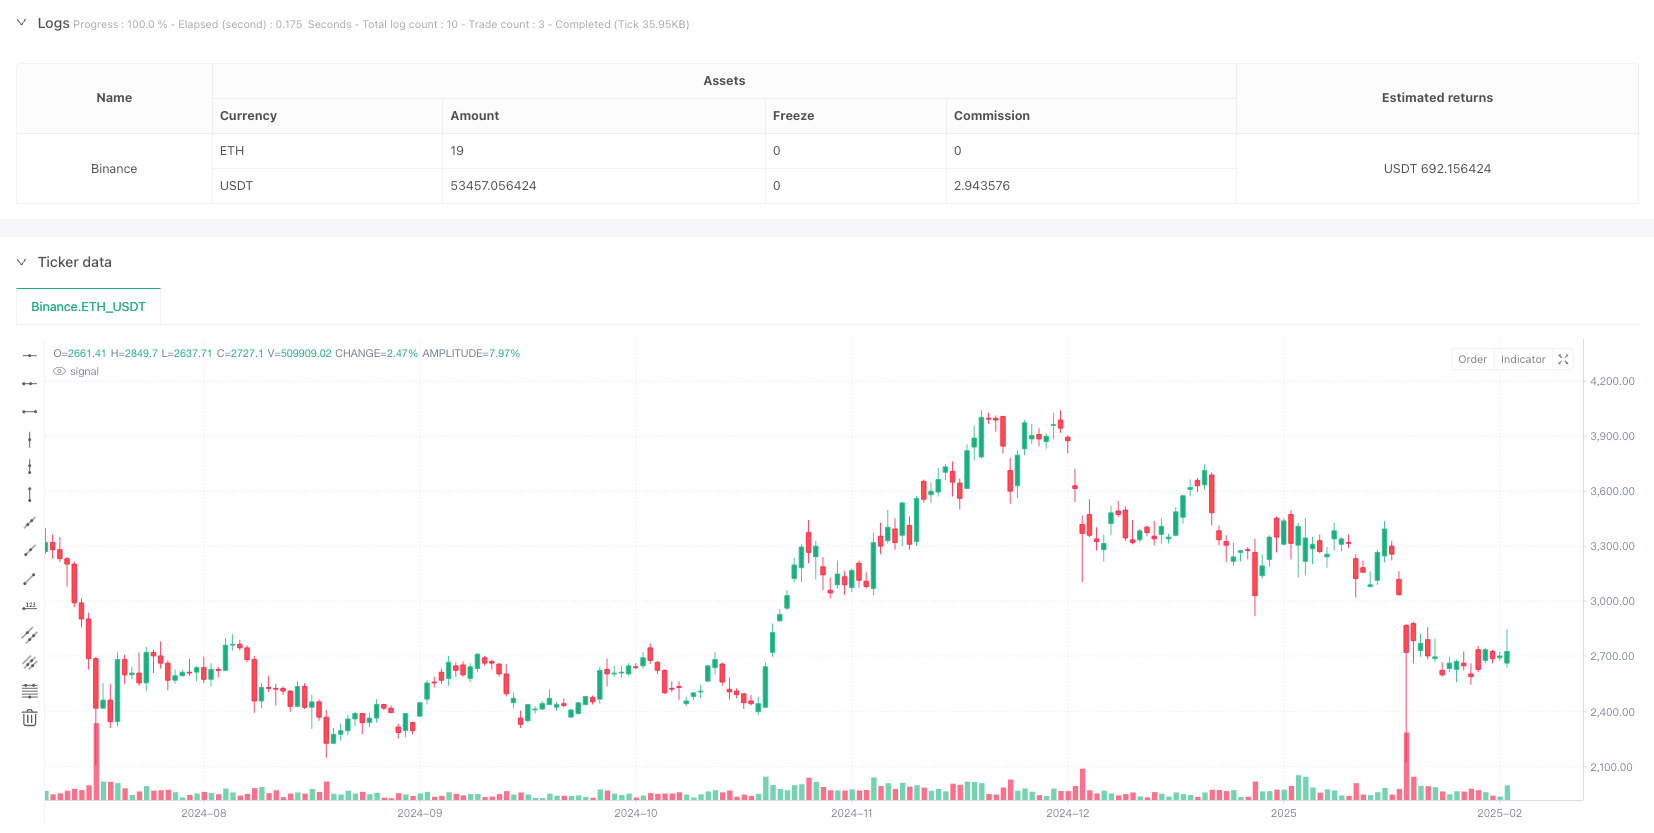
本策略是一个基于多重技术形态识别的高级交易系统,综合了蜡烛图形态分析和突破交易原理。策略能够识别并交易多种经典的蜡烛图形态,包括十字星形态(Doji)、锤子线(Hammer)和针形态(Pin Bar),同时结合双蜡烛确认系统来增强交易信号的可靠性。
策略原理
策略的核心逻辑建立在以下几个关键要素之上: 1. 形态识别系统 - 通过精确的数学计算来识别三种关键的蜡烛图形态:十字星、锤子线和针形态。每种形态都有其独特的识别标准,如实体与影线的比例关系。 2. 突破确认机制 - 采用双蜡烛确认系统,要求第二根蜡烛线突破前一根蜡烛线的高点(做多)或低点(做空),以减少虚假信号。 3. 目标价位确定 - 使用可调整的回溯期(默认20个周期)来确定最近的高点或低点作为目标价位,使策略具有动态适应性。
策略优势
- 多重形态识别 - 通过同时监控多个技术形态,显著增加了潜在的交易机会。
- 信号确认机制 - 双蜡烛确认系统有效降低了虚假信号的风险。
- 可视化交易区间 - 使用颜色框来标示交易区间,使交易目标更加直观。
- 灵活的参数调整 - 可根据不同市场条件调整回溯期等参数。
策略风险
- 市场波动风险 - 在高波动期间可能产生虚假突破信号。
- 滑点风险 - 在流动性较差的市场中,实际成交价可能与信号价格存在较大偏差。
- 趋势反转风险 - 在强趋势市场中,反转信号可能导致较大损失。
优化方向
- 引入成交量确认 - 建议在形态识别系统中加入成交量分析,以提高信号的可靠性。
- 动态止损机制 - 可以基于ATR或波动率来设置动态止损位。
- 市场环境过滤 - 添加趋势强度指标,在强趋势期间过滤掉反转信号。
- 时间框架优化 - 考虑在多个时间框架上进行信号确认。
总结
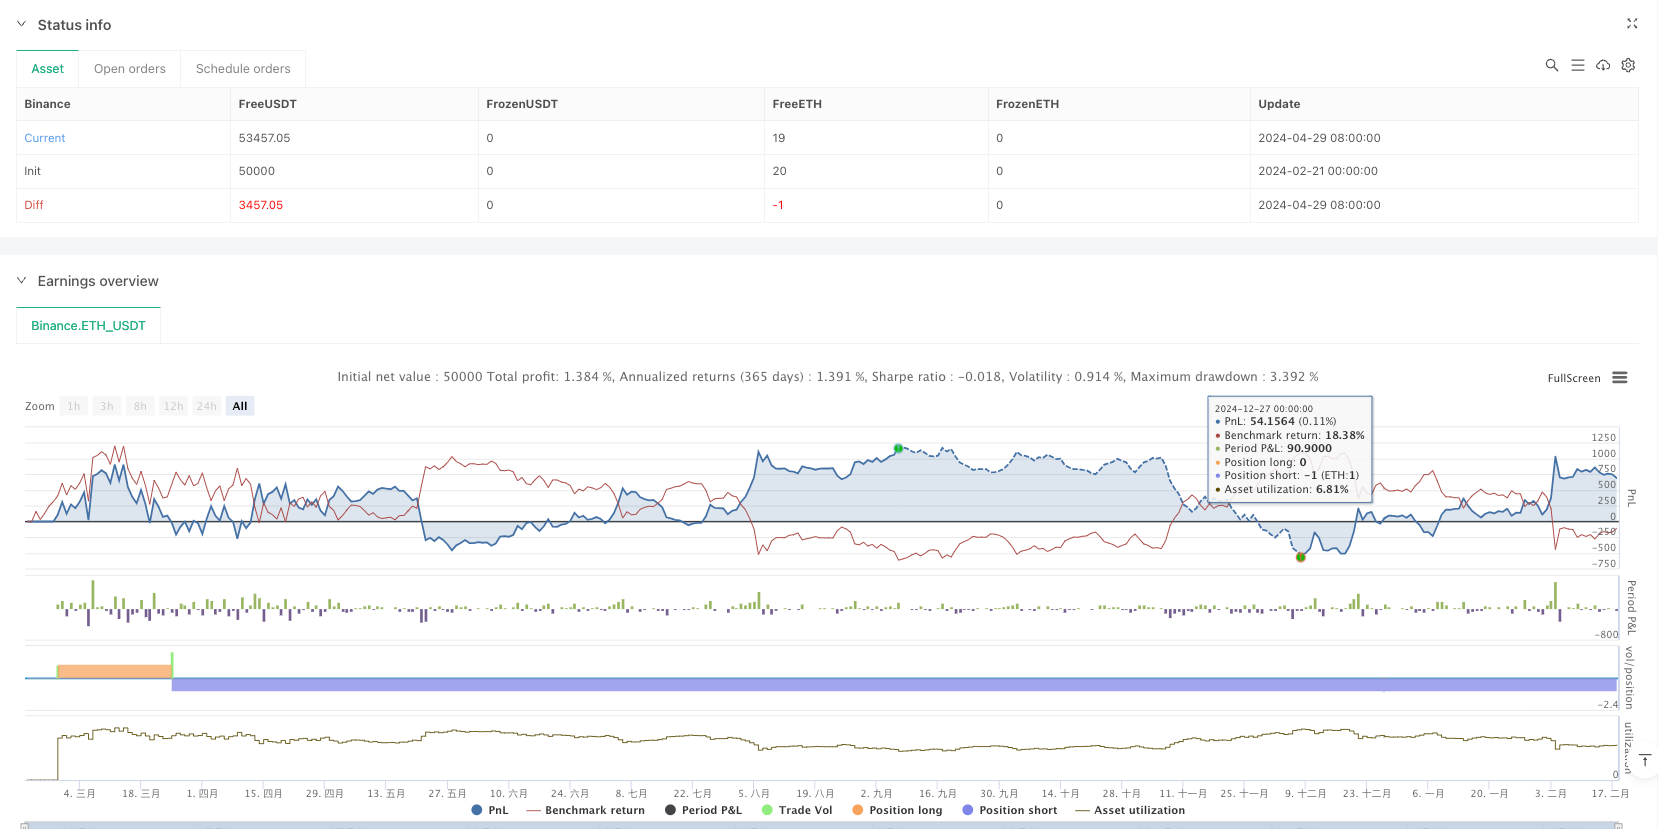
该策略通过结合多重技术形态分析和突破交易原理,建立了一个完整的交易系统。其优势在于信号的多维度确认和灵活的参数调整,但同时也需要注意市场波动和流动性风险。通过建议的优化方向,策略的稳定性和可靠性还可以进一步提升。
策略源码
/*backtest
start: 2024-02-21 00:00:00
end: 2025-02-18 08:00:00
period: 1d
basePeriod: 1d
exchanges: [{"eid":"Binance","currency":"ETH_USDT"}]
*/

//@version=5
strategy("Target(Made by Karan)", overlay=true)

// Input for lookback period
lookbackPeriod = input.int(20, title="Lookback Period for Recent High/Low", minval=1)

// --- Pattern Identification Functions ---

// Identify Doji pattern
isDoji(open, high, low, close) =>
    bodySize = math.abs(close - open)
    rangeSize = high - low
    bodySize <= rangeSize * 0.1  // Small body compared to total range

// Identify Hammer pattern
isHammer(open, high, low, close) =>
    bodySize = math.abs(close - open)
    lowerShadow = open - low
    upperShadow = high - close
    bodySize <= (high - low) * 0.3 and lowerShadow > 2 * bodySize and upperShadow <= bodySize * 0.3  // Long lower shadow, small upper shadow

// Identify Pin Bar pattern
isPinBar(open, high, low, close) =>
    bodySize = math.abs(close - open)
    rangeSize = high - low
    upperShadow = high - math.max(open, close)
    lowerShadow = math.min(open, close) - low
    (upperShadow > bodySize * 2 and lowerShadow < bodySize) or (lowerShadow > bodySize * 2 and upperShadow < bodySize)  // Long shadow on one side

// --- Candle Breakout Logic ---

// Identify the first green candle (Bullish)
is_first_green_candle = close > open

// Identify the breakout above the high of the first green candle
breakout_green_candle = ta.crossover(close, high[1]) and is_first_green_candle[1]

// Identify the second green candle confirming the breakout
second_green_candle = close > open and breakout_green_candle[1]

// Find the recent high (for the target)
recent_high = ta.highest(high, lookbackPeriod)  // Use adjustable lookback period

// Plot the green rectangle box if the conditions are met and generate buy signal
var float start_price_green = na
var float end_price_green = na

if second_green_candle
    start_price_green := low[1]  // Low of the breakout green candle
    end_price_green := recent_high  // The most recent high in the lookback period
    strategy.entry("Buy", strategy.long)  // Buy signal

// --- Red Candle Logic ---

// Identify the first red candle (Bearish)
is_first_red_candle = close < open

// Identify the breakdown below the low of the first red candle
breakdown_red_candle = ta.crossunder(close, low[1]) and is_first_red_candle[1]

// Identify the second red candle confirming the breakdown
second_red_candle = close < open and breakdown_red_candle[1]

// Find the recent low (for the target)
recent_low = ta.lowest(low, lookbackPeriod)  // Use adjustable lookback period

// Plot the red rectangle box if the conditions are met and generate sell signal
var float start_price_red = na
var float end_price_red = na

if second_red_candle
    start_price_red := high[1]  // High of the breakout red candle
    end_price_red := recent_low  // The most recent low in the lookback period
    strategy.entry("Sell", strategy.short)  // Sell signal

// --- Pattern Breakout Logic for Doji, Hammer, Pin Bar ---

// Detect breakout of Doji, Hammer, or Pin Bar patterns
var float start_price_pattern = na
var float end_price_pattern = na

// Check for Doji breakout
if isDoji(open, high, low, close) and ta.crossover(close, high[1])
    start_price_pattern := low[1]  // Low of the breakout Doji
    end_price_pattern := recent_high  // The most recent high in the lookback period
    box.new(left = bar_index[1], right = bar_index, top = end_price_pattern, bottom = start_price_pattern, border_color = color.new(color.blue, 0), bgcolor = color.new(color.blue, 80))
    strategy.entry("Buy Doji", strategy.long)  // Buy signal for Doji breakout

// Check for Hammer breakout
if isHammer(open, high, low, close) and ta.crossover(close, high[1])
    start_price_pattern := low[1]  // Low of the breakout Hammer
    end_price_pattern := recent_high  // The most recent high in the lookback period
    box.new(left = bar_index[1], right = bar_index, top = end_price_pattern, bottom = start_price_pattern, border_color = color.new(color.blue, 0), bgcolor = color.new(color.blue, 80))
    strategy.entry("Buy Hammer", strategy.long)  // Buy signal for Hammer breakout

// Check for Pin Bar breakout
if isPinBar(open, high, low, close) and ta.crossover(close, high[1])
    start_price_pattern := low[1]  // Low of the breakout Pin Bar
    end_price_pattern := recent_high  // The most recent high in the lookback period
    box.new(left = bar_index[1], right = bar_index, top = end_price_pattern, bottom = start_price_pattern, border_color = color.new(color.blue, 0), bgcolor = color.new(color.blue, 80))
    strategy.entry("Buy Pin Bar", strategy.long)  // Buy signal for Pin Bar breakout

// Check for bearish Doji breakout
if isDoji(open, high, low, close) and ta.crossunder(close, low[1])
    start_price_pattern := high[1]  // High of the breakdown Doji
    end_price_pattern := recent_low  // The most recent low in the lookback period
    box.new(left = bar_index[1], right = bar_index, top = start_price_pattern, bottom = end_price_pattern, border_color = color.new(color.orange, 0), bgcolor = color.new(color.orange, 80))
    strategy.entry("Sell Doji", strategy.short)  // Sell signal for Doji breakdown

// Check for bearish Hammer breakout
if isHammer(open, high, low, close) and ta.crossunder(close, low[1])
    start_price_pattern := high[1]  // High of the breakdown Hammer
    end_price_pattern := recent_low  // The most recent low in the lookback period
    box.new(left = bar_index[1], right = bar_index, top = start_price_pattern, bottom = end_price_pattern, border_color = color.new(color.orange, 0), bgcolor = color.new(color.orange, 80))
    strategy.entry("Sell Hammer", strategy.short)  // Sell signal for Hammer breakdown

// Check for bearish Pin Bar breakout
if isPinBar(open, high, low, close) and ta.crossunder(close, low[1])
    start_price_pattern := high[1]  // High of the breakdown Pin Bar
    end_price_pattern := recent_low  // The most recent low in the lookback period
    box.new(left = bar_index[1], right = bar_index, top = start_price_pattern, bottom = end_price_pattern, border_color = color.new(color.orange, 0), bgcolor = color.new(color.orange, 80))
    strategy.entry("Sell Pin Bar", strategy.short)  // Sell signal for Pin Bar breakdown

// Optional: Plot shapes for the green sequence of candles
plotshape(series=is_first_green_candle, location=location.belowbar, color=color.green, style=shape.labelup, text="1st Green")
plotshape(series=breakout_green_candle, location=location.belowbar, color=color.blue, style=shape.labelup, text="Breakout")
plotshape(series=second_green_candle, location=location.belowbar, color=color.orange, style=shape.labelup, text="2nd Green")

// Optional: Plot shapes for the red sequence of candles
plotshape(series=is_first_red_candle, location=location.abovebar, color=color.red, style=shape.labeldown, text="1st Red")
plotshape(series=breakdown_red_candle, location=location.abovebar, color=color.blue, style=shape.labeldown, text="Breakdown")
plotshape(series=second_red_candle, location=location.abovebar, color=color.orange, style=shape.labeldown, text="2nd Red")
相关推荐