Dynamic Multi-Period Trend Prediction with Moving Average Filter Strategy

Overview
This strategy is a trend following system that combines traditional technical analysis with modern artificial intelligence methods. It primarily uses Exponential Moving Average (EMA) and Simple Moving Average (SMA) as trend filters, while incorporating a prediction model to optimize entry timing. The strategy is specifically optimized for daily timeframes, aiming to capture medium to long-term market trends.
Strategy Principles
The core logic consists of three main components:
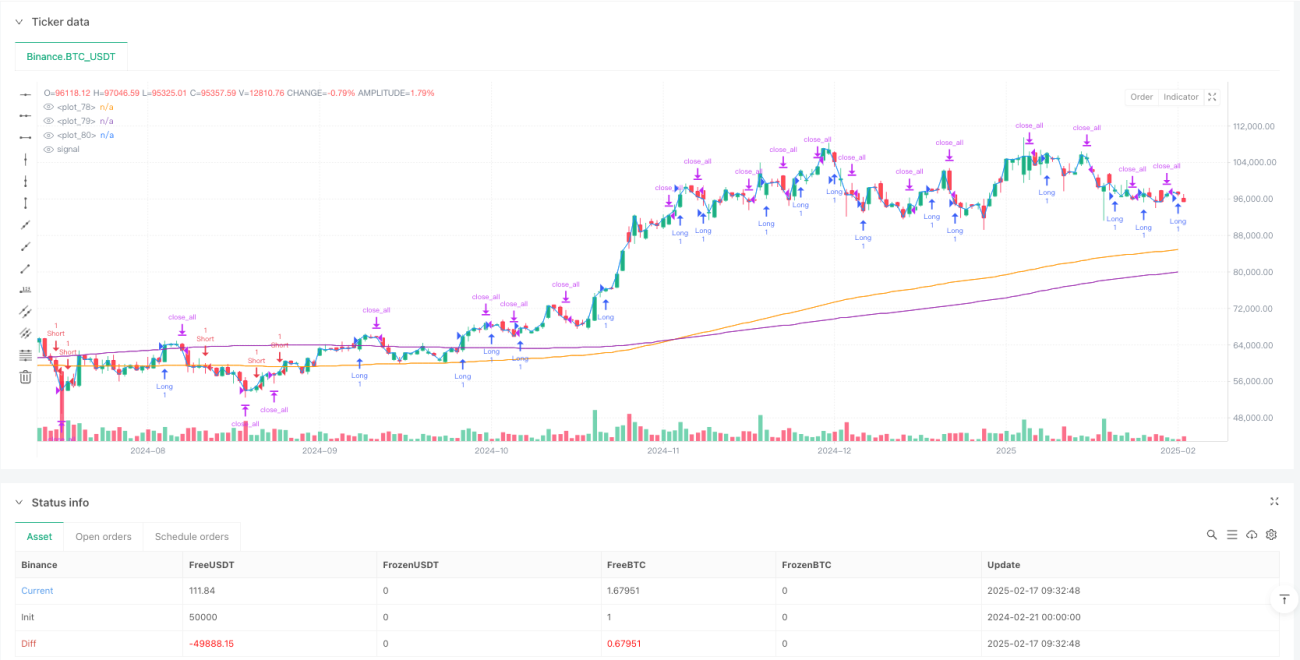
- Trend Determination System - Uses 200-period EMA and SMA as primary trend filters, determining current trend direction through price-to-moving average relationships
- Prediction Module - Employs an expandable prediction component, currently using simulated predictions, with the capability to be replaced by machine learning models
- Position Management - Sets a fixed 4-bar holding period to control position duration and risk
Trade signals require consistency between trend direction and prediction signals:
- Long signals: Price above both EMA and SMA, with positive prediction value
- Short signals: Price below both EMA and SMA, with negative prediction value
Strategy Advantages
- Clear Structure - Simple and intuitive strategy logic, easy to understand and maintain
- Controlled Risk - Effective risk control through fixed holding periods and dual moving average filters
- High Scalability - Flexible prediction module design, capable of integrating different prediction models
- Good Adaptability - Adjustable parameters to adapt to different market environments
- Moderate Trading Frequency - Daily timeframe operations reduce trading costs and psychological pressure
Strategy Risks
- Trend Reversal Risk - Potential consecutive losses at trend turning points
- Parameter Sensitivity - Moving average and holding period selections significantly impact strategy performance
- Model Dependency - Prediction module accuracy directly affects strategy effectiveness
- Slippage Impact - Daily timeframe operations may face significant slippage
- Market Environment Dependency - May underperform in ranging markets
Strategy Optimization Directions
- Prediction Model Upgrade - Introduce machine learning models to replace existing random predictions
- Dynamic Holding Period - Adjust holding time based on market volatility
- Stop-Loss Optimization - Add dynamic stop-loss mechanisms to improve risk control
- Position Management - Introduce volatility-based position management system
- Multi-dimensional Filtering - Add volume, volatility, and other auxiliary indicators
Summary
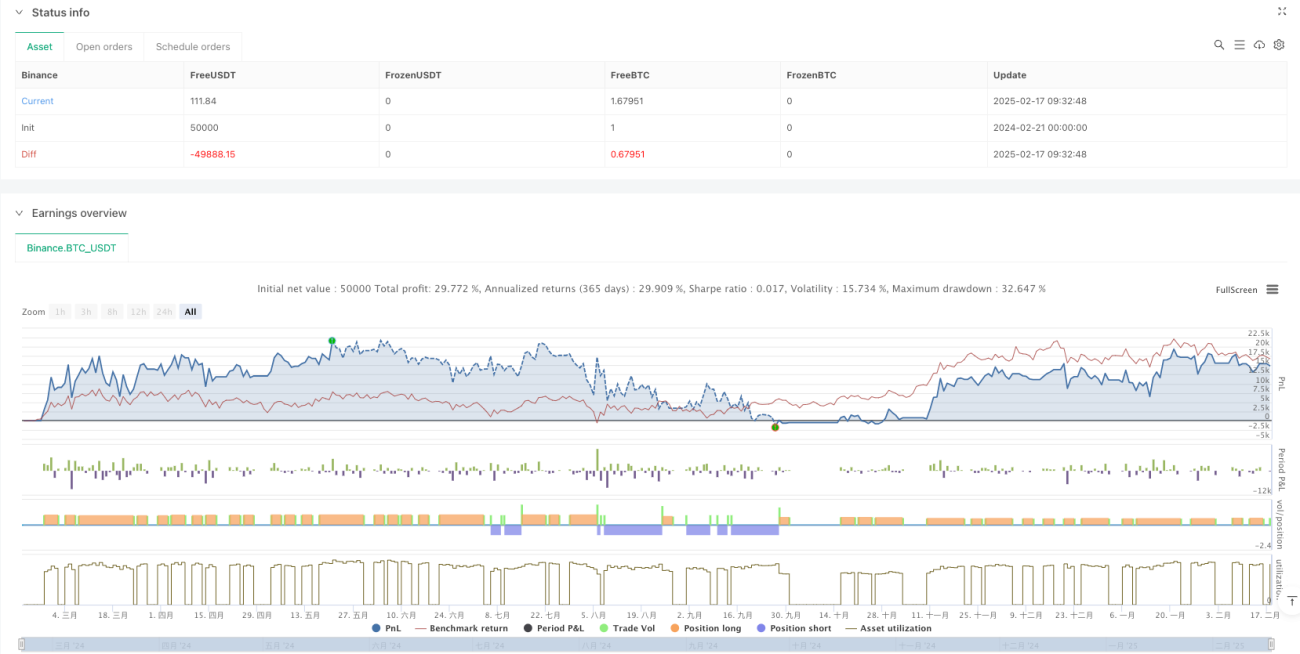
This strategy builds a robust trend following system by combining traditional technical analysis with modern prediction methods. Its main advantages lie in clear logic, controlled risk, and strong scalability. Through strategy optimization, particularly in prediction models and risk control improvements, it has the potential to further enhance stability and profitability. The strategy is suitable for investors seeking medium to long-term stable returns.
- 1