
Overview
This strategy is a trading system that combines dual moving average crossover signals with dynamic risk management. It generates trading signals through the crossover of short-term and long-term moving averages while using the ATR indicator to dynamically adjust stop-loss and take-profit levels. The strategy also incorporates time filtering and a cooldown period to optimize trade quality, along with risk-reward ratio and per-trade risk percentage management mechanisms.
Strategy Principles
The strategy is based on several core components:
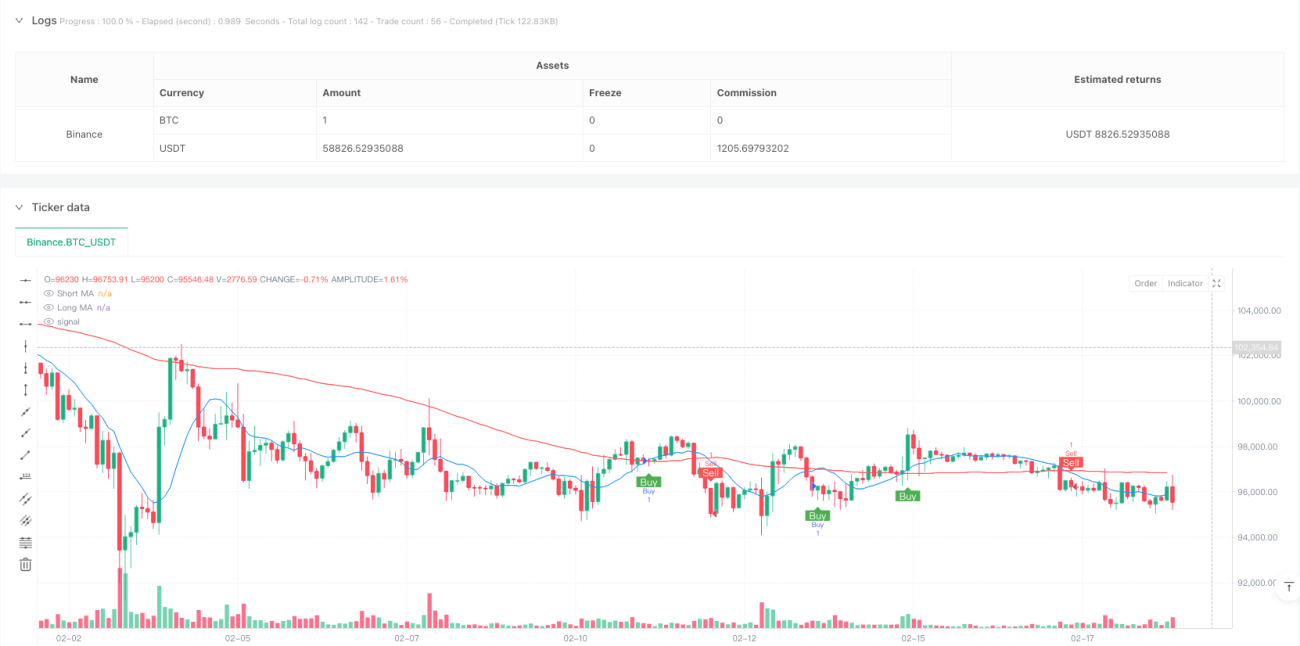
- The signal generation system uses the crossover of short-term (10-period) and long-term (100-period) simple moving averages to trigger trades. A buy signal is generated when the short-term MA crosses above the long-term MA, and vice versa.
- The risk management system uses a 14-period ATR multiplied by 1.5 to set dynamic stop-loss distances, with the profit target being twice the stop-loss distance (adjustable risk-reward ratio).
- A time filter allows users to set specific trading hours, executing trades only within the specified time range.
- A trading cooldown mechanism sets a 10-period waiting time to prevent overtrading.
- Risk per trade is controlled at 1% of the account (adjustable).
Strategy Advantages
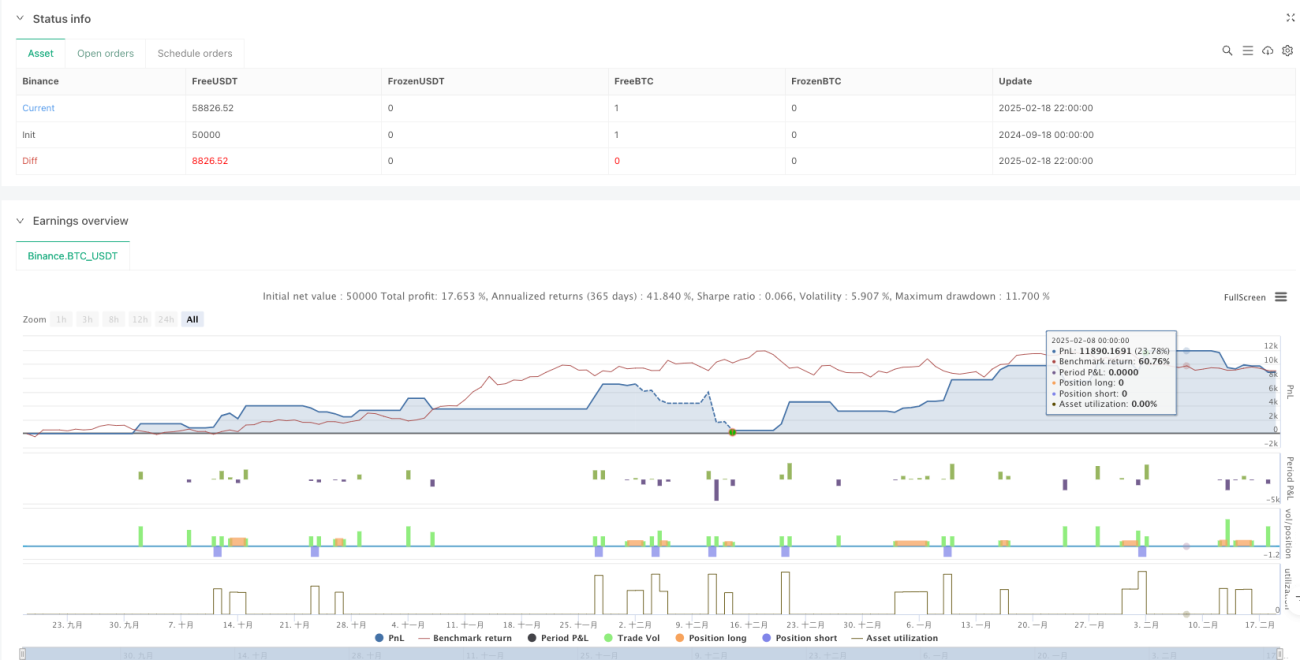
- Dynamic Risk Management: Uses the ATR indicator to adapt to market volatility, automatically adjusting stop-loss and take-profit distances in different market conditions.
- Comprehensive Risk Control: Achieves systematic money management through set risk-reward ratios and per-trade risk percentages.
- Flexible Time Management: Can adjust trading hours according to different market characteristics.
- Overtrading Prevention: Cooldown mechanism effectively prevents excessive trading signals during volatile periods.
- Visualization: Clearly displays trading signals and moving averages on the chart for analysis and optimization.
Strategy Risks
- Trend Reversal Risk: May generate false breakout signals in ranging markets, leading to consecutive stops.
- Parameter Sensitivity: The choice of moving average periods, ATR multiplier, and other parameters significantly affects strategy performance.
- Improper time filter settings may miss important trading opportunities.
- Fixed risk-reward ratio may not be flexible enough for different market conditions.
Strategy Optimization Directions
- Introduce Trend Strength Filter: Add ADX or similar indicators to assess trend strength, trading only during strong trends.
- Dynamic Risk-Reward Ratio Adjustment: Automatically adjust risk-reward ratio based on market volatility or trend strength.
- Add Volume Analysis: Incorporate volume as a supplementary indicator for signal confirmation.
- Optimize Cooldown Mechanism: Make cooldown period length dynamically adjust based on market volatility.
- Implement Market Environment Classification: Use different parameter combinations in different market environments.
Summary
This strategy builds a complete trading system by combining classical technical analysis methods with modern risk management concepts. Its core advantages lie in dynamic risk management and multiple filtering mechanisms, but parameters still need to be optimized based on specific market characteristics in practical applications. Successful strategy operation requires traders to deeply understand the function of each component and adjust parameters timely according to market changes. Through the suggested optimization directions, the strategy has the potential to achieve more stable performance across different market environments.
/*backtest
start: 2024-09-18 00:00:00
end: 2025-02-19 00:00:00
period: 2h
basePeriod: 2h
exchanges: [{"eid":"Binance","currency":"BTC_USDT"}]
*/

//@version=5
strategy("Profitable Moving Average Crossover Strategy", shorttitle="Profitable MA Crossover", overlay=true)

// Input parameters for the moving averages- 1