
Overview
This strategy is a multi-timeframe swing trading system based on the Stochastic Oscillator. It identifies trading opportunities by combining stochastic signals from current and higher timeframes, using dynamic take-profit and stop-loss levels for risk management. The strategy is designed for volatile markets, aiming to capture short-term price movements for profit.
Strategy Principles
The core logic is based on several key elements:
- Using Stochastic Oscillator confirmation on two timeframes (current and higher)
- Looking for crossover signals in overbought/oversold zones
- Buy conditions: K line crosses above D line in current timeframe with K<20; higher timeframe K<20 and K>D
- Sell conditions: K line crosses below D line in current timeframe with K>80; higher timeframe K>80 and K<D
- Dynamic take-profit and stop-loss system based on entry price, with adjustable multipliers
Strategy Advantages
- Multi-timeframe signal confirmation improves reliability and reduces false signals
- Trading in overbought/oversold zones increases probability of trend reversal
- Dynamic TP/SL system automatically adjusts to market volatility, enhancing money management flexibility
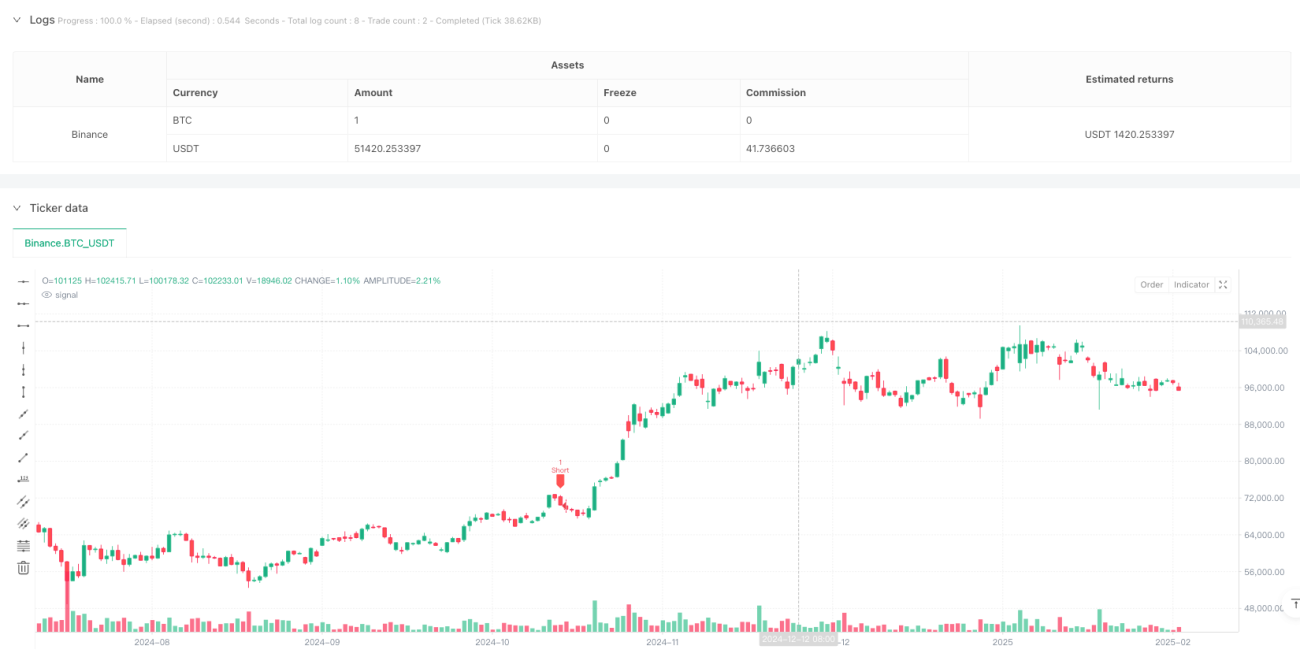
- Visual interface clearly displays trading signals and TP/SL levels for better understanding
- Adjustable parameters allow adaptation to different market conditions
Strategy Risks
- Frequent stop-losses may occur in highly volatile markets
- Dual timeframe confirmation might cause missed trading opportunities
- Fixed multiplier TP/SL may not suit all market conditions
- Potential early profit taking in strong trends
- Requires careful parameter optimization to balance reward and risk
Optimization Directions
- Implement adaptive TP/SL mechanism based on market volatility
- Add trend filter for adjusting trade direction in strong trends
- Incorporate volume indicators as confirmation signals
- Develop more sophisticated position sizing system
- Consider adding market sentiment indicators for entry timing optimization
Summary
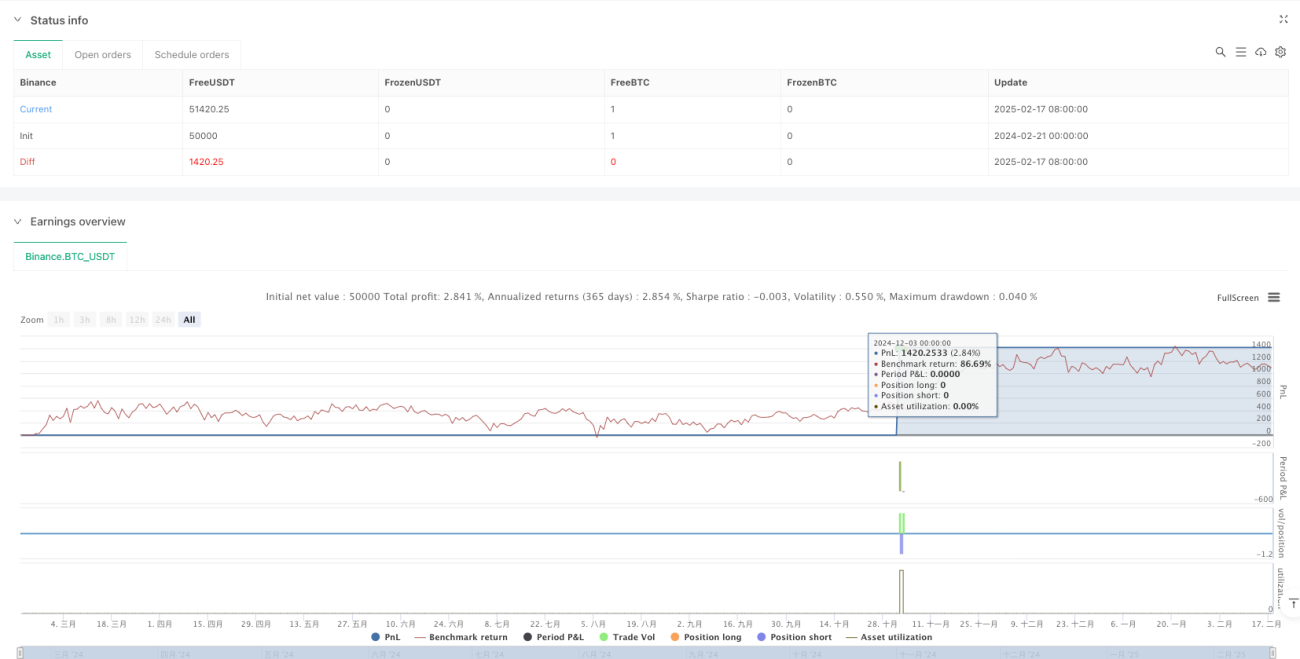
This is a comprehensive trading system combining technical analysis and risk management. Through multi-timeframe signal confirmation and dynamic TP/SL, the strategy maintains stability while offering good profit potential. However, users need to optimize parameters according to their trading style and market conditions, always maintaining strict risk control.
- 1