
Overview
This strategy is a quantitative trading system that combines volatility breakout, trend following, and momentum confirmation. It identifies trading opportunities by calculating ATR-based dynamic breakthrough levels combined with EMA trend filtering and RSI momentum indicators. The strategy employs strict risk control measures, including fixed percentage risk management and dynamic stop-loss settings.
Strategy Principles
The strategy consists of three core components:
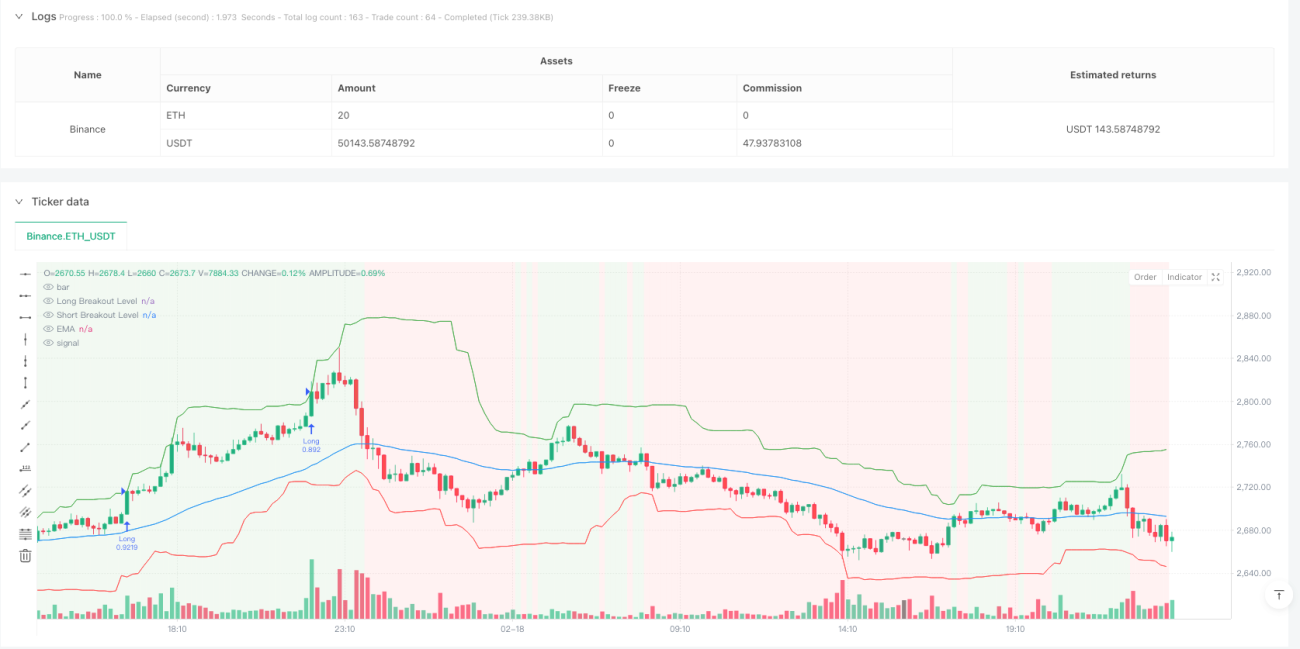
- Volatility Breakout Calculation: Uses highest and lowest prices within the lookback period, combined with ATR multiplier to calculate dynamic breakthrough thresholds, avoiding look-ahead bias.
- Trend Filtering: Uses short-term EMA to determine current trend direction, only taking long positions above EMA and short positions below EMA.
- Momentum Confirmation: Uses RSI indicator to confirm market momentum, requiring RSI above 50 for long entries and below 50 for short entries.
Strategy Advantages
- Dynamic Adaptability: Breakthrough levels automatically adjust based on market volatility, allowing the strategy to adapt to different market environments.
- Multiple Filters: Combines trend and momentum indicators to reduce false signals.
- Strict Risk Control: Uses fixed risk percentage for position management and dynamic stop-loss protection.
- High Customizability: Key parameters such as ATR period, breakthrough multiplier, EMA period can be adjusted according to specific needs.
Strategy Risks
- Lag Risk: Using moving averages may lead to delayed entry points.
- Sideways Market Risk: May generate frequent false breakthrough signals in ranging markets.
- Parameter Sensitivity: Strategy performance is sensitive to parameter settings, requiring thorough testing.
Solutions:
- Recommend backtesting and optimization under different market conditions
- Can add market environment recognition module
- Suggest adopting more conservative money management approach
Optimization Directions
- Market Environment Adaptation: Add volatility range judgment, using different parameter settings in different volatility environments.
- Signal Optimization: Consider adding volume confirmation to improve breakthrough signal reliability.
- Stop Profit/Loss Optimization: Implement dynamically adjusting risk-reward ratio based on market volatility.
- Time Filtering: Add trading time window filters to avoid trading during unfavorable periods.
Summary
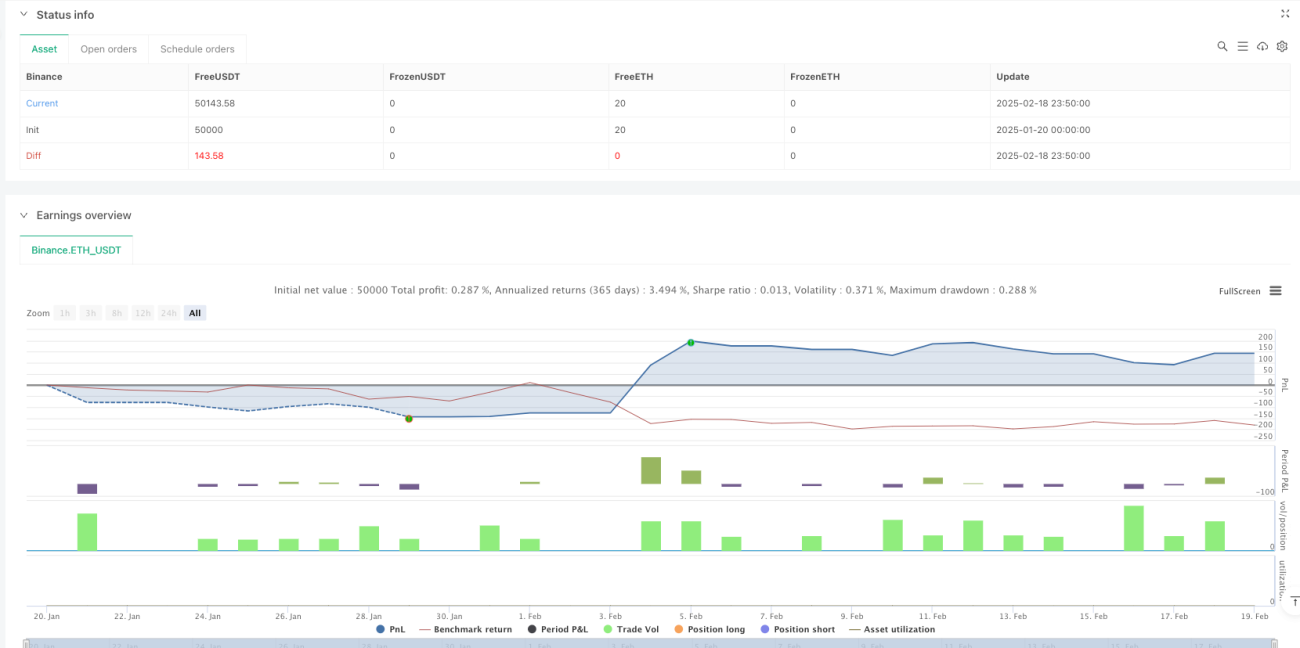
This is a well-structured quantitative trading strategy with clear logic. By combining volatility breakout, trend following, and momentum confirmation, it captures significant price movements while controlling risk. The strategy's high customizability makes it suitable for further optimization to adapt to different trading instruments and market environments. It is recommended to conduct thorough parameter optimization and backtesting before live trading.
- 1