Dynamic Risk-Controlled Supertrend Engulfing Pattern Strategy

Overview
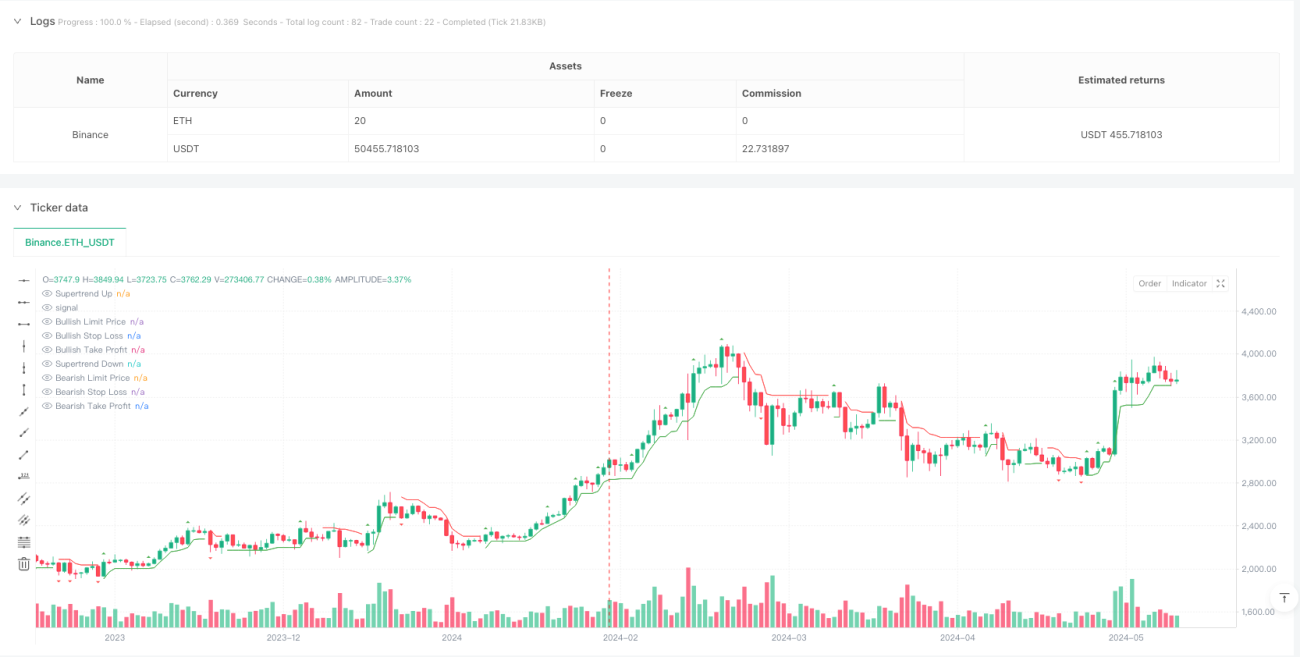
This is an advanced trading strategy that combines the Supertrend indicator with engulfing candlestick patterns. The strategy identifies engulfing patterns in the market and confirms them with the Supertrend indicator's trend direction to achieve precise trade signal filtering. It also incorporates dynamic stop-loss and take-profit settings to effectively control risk while ensuring profit potential.
Strategy Principles
The strategy is based on the following core principles:
- Uses ATR (Average True Range) to calculate the Supertrend indicator for determining overall market trend.
- Filters effective engulfing patterns through Boring Candle Threshold and Engulfing Candle Threshold settings.
- Only enters trades when Supertrend trend direction aligns with engulfing pattern direction.
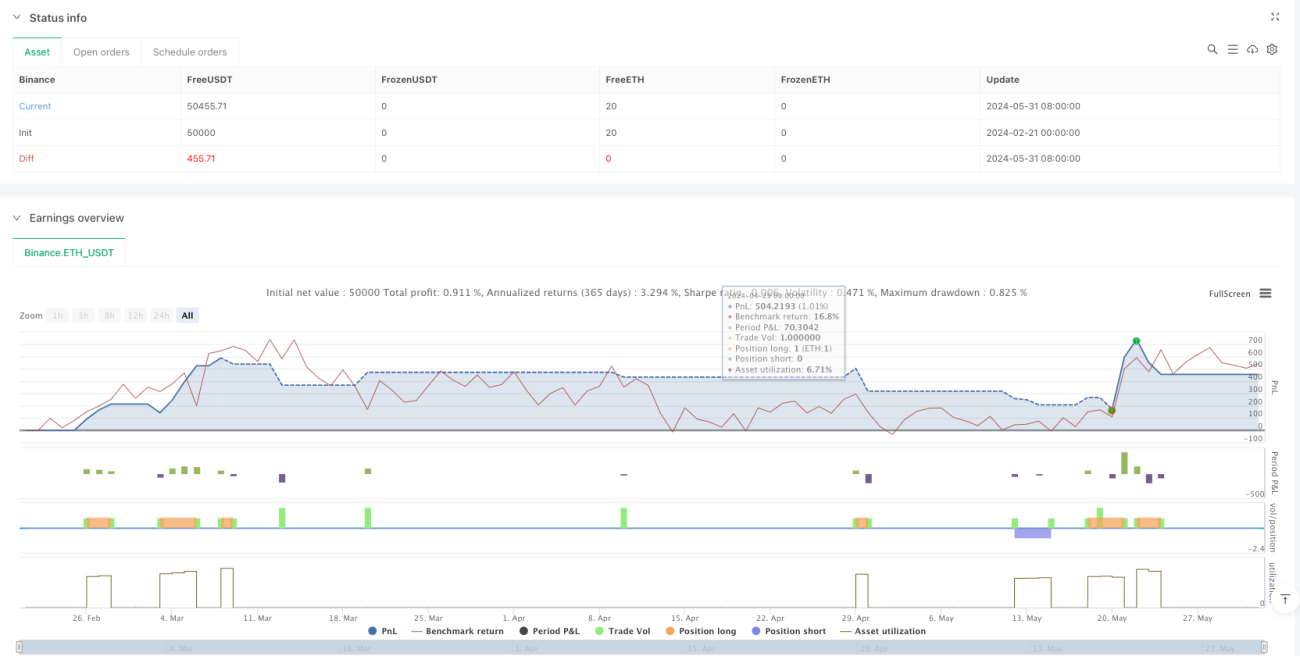
- Employs dynamic stop-loss and take-profit levels calculated proportionally from entry price.
- Implements position management ensuring only one trade direction at a time.
Strategy Advantages
- Strict signal quality control through dual confirmation (trend + pattern).
- Introduction of boring candle and engulfing thresholds effectively filters false signals.
- ATR-based dynamic Supertrend calculation provides good market adaptability.
- Comprehensive stop-loss and profit management mechanism.
- Excellent visualization of trade signals, stop-loss levels, and profit targets.
Strategy Risks
- May generate frequent false breakout signals in ranging markets.
- Fixed stop-loss and take-profit settings might not suit all market conditions.
- Potential for significant drawdowns during trend reversals.
- Sensitivity to parameter settings may lead to poor strategy performance.
- Slippage risks in markets with lower liquidity.
Optimization Directions
- Consider incorporating volume indicators for signal confirmation.
- Implement dynamic ATR multiplier adjustment mechanism.
- Develop dynamic stop-loss and take-profit ratios based on market volatility.
- Add time filters to avoid trading during unsuitable periods.
- Consider adding trend strength filters to improve trade quality.
Summary
This is a well-designed strategy with clear logic that achieves good signal quality control through combined technical indicators and pattern analysis. The strategy features comprehensive risk management mechanisms and excellent visualization, making it suitable for live testing and optimization. Traders should pay attention to parameter optimization and market environment selection during practical application.
- 1