
概述
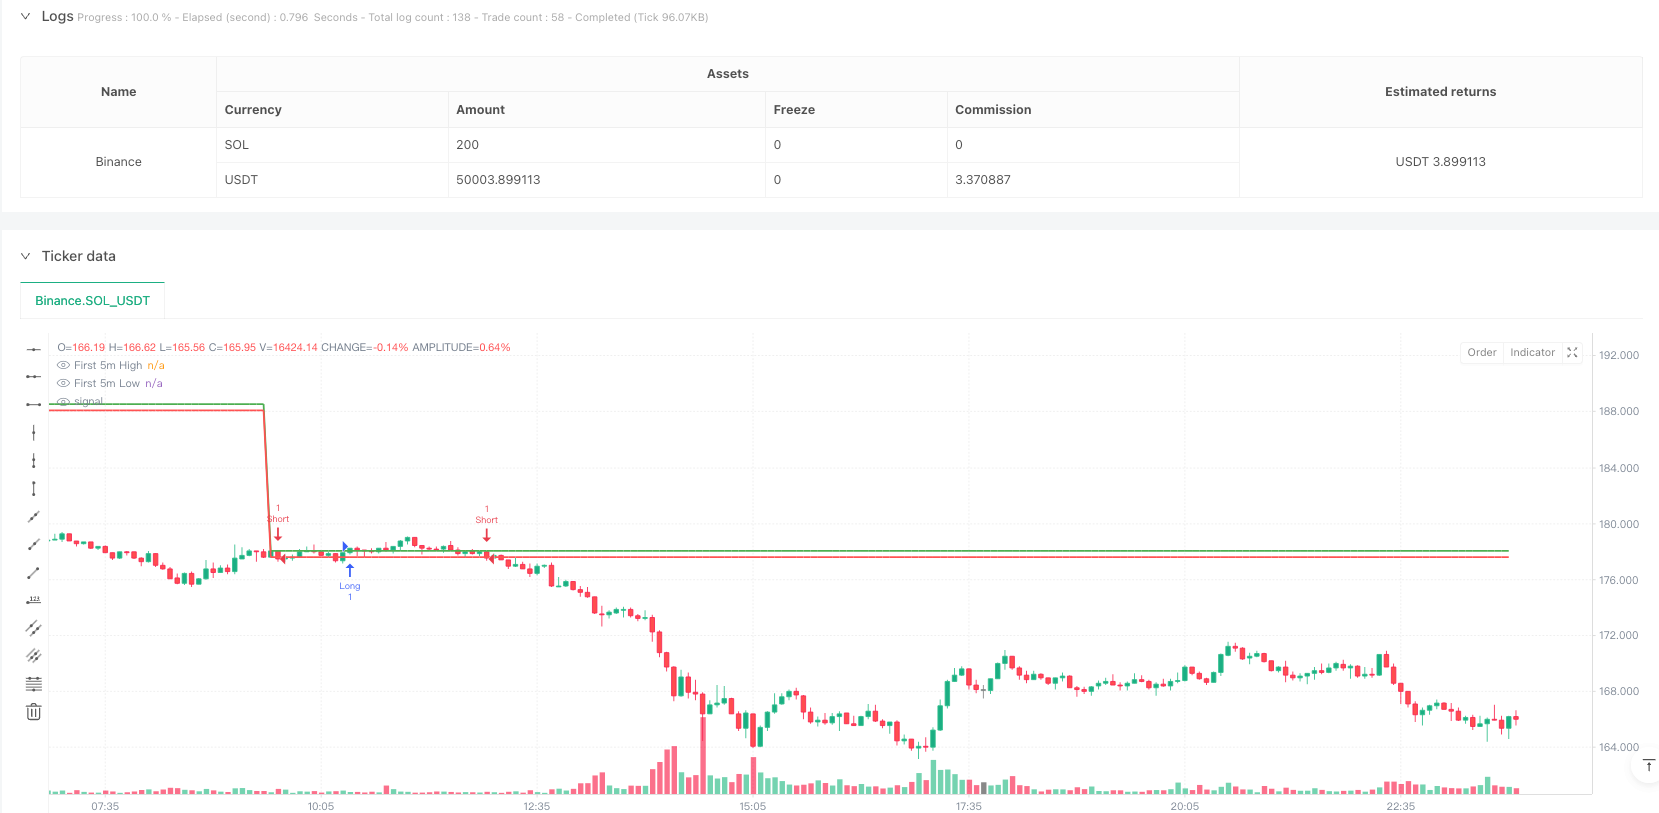
该策略是一个基于五分钟开盘突破的量化交易系统,结合ATR指标进行动态止盈止损管理。策略主要通过识别开盘后第一根五分钟K线的高低点作为关键价格区间,当价格突破该区间时触发交易信号,并使用基于ATR的动态止损来控制风险。
策略原理
策略的核心逻辑包含以下几个关键步骤: 1. 确定交易时段起始点(以纽约证券交易所9:30开盘为例) 2. 捕捉开盘后第一根五分钟K线,记录其开盘价、最高价和最低价 3. 当价格突破第一根K线高点时,触发做多信号;突破低点时,触发做空信号 4. 使用14周期ATR指标计算波动率,用于设置动态止损位 5. 采用1:1.5的风险收益比设置止盈止损,其中止损距离为1倍ATR,止盈距离为突破区间的1.5倍
策略优势
- 时间框架精准:专注于开盘后最活跃的五分钟交易时段,捕捉市场初始波动
- 风险管理完善:通过ATR动态调整止损位置,适应市场波动性变化
- 执行标准化:使用明确的突破信号和固定的风险收益比,降低主观判断
- 自适应性强:ATR指标能根据市场波动度自动调整止损范围
- 操作简单直观:策略逻辑清晰,便于实际执行和回测验证
策略风险
- 假突破风险:开盘时段波动可能造成虚假突破信号
- 滑点影响:高波动期间的订单执行可能面临较大滑点
- ATR参数敏感:14周期设置可能不适合所有市场环境
- 固定倍数局限:1:1.5的风险收益比可能需要根据品种特性调整
- 交易成本考量:频繁交易可能产生较高交易成本
策略优化方向
- 信号过滤:引入成交量确认或动量指标,减少假突破
- 参数自适应:开发ATR周期的动态调整机制
- 时间过滤:增加具体时间段的交易限制,避开低效率时段
- 止损优化:研究基于市场微观结构的止损方法
- 分品种优化:根据不同交易品种的特性调整风险收益比
总结
这是一个结构完整、逻辑清晰的量化交易策略,通过对开盘价格突破的监测和ATR动态止损的运用,实现了风险可控的自动化交易。策略的核心优势在于其简单而有效的设计理念,但也需要针对不同市场环境和交易品种进行持续优化。建议交易者在实盘使用前进行充分的回测验证,并根据实际情况调整参数设置。
策略源码
/*backtest
start: 2025-02-13 00:00:00
end: 2025-02-19 00:00:00
period: 5m
basePeriod: 5m
exchanges: [{"eid":"Binance","currency":"SOL_USDT"}]
*/

//@version=5
strategy("5-Min Open Candle Breakout", overlay=true)

// Get the current bar's year, month, and day
currentYear = year
currentMonth = month
currentDay = dayofmonth

// Define session start time (adjust based on market)
sessionStart = timestamp(currentYear, currentMonth, currentDay, 9, 30) // 9:30 AM for NYSE

// Identify the first 5-minute candle
isFirstCandle = (time >= sessionStart and time < sessionStart + 300000)  // 5 min = 300,000 ms

var float openPrice = na
var float highPrice = na
var float lowPrice = na

if isFirstCandle
    openPrice := open
    highPrice := high
    lowPrice := low

// Breakout Conditions
longEntry = ta.crossover(close, highPrice)
shortEntry = ta.crossunder(close, lowPrice)

// Define Stop Loss & Take Profit (Ratio 1:1.5)
slFactor = 1.0  // Stop Loss Multiplier
tpFactor = 1.5  // Take Profit Multiplier

atrValue = ta.atr(14)  // Fix: Use ta.atr() instead of atr()

longSL = lowPrice - atrValue * slFactor
longTP = highPrice + (highPrice - lowPrice) * tpFactor

shortSL = highPrice + atrValue * slFactor
shortTP = lowPrice - (highPrice - lowPrice) * tpFactor

// Execute Trades
strategy.entry("Long", strategy.long, when=longEntry)
strategy.exit("Exit Long", from_entry="Long", stop=longSL, limit=longTP)

strategy.entry("Short", strategy.short, when=shortEntry)
strategy.exit("Exit Short", from_entry="Short", stop=shortSL, limit=shortTP)

// Plot High/Low of First Candle
plot(highPrice, title="First 5m High", color=color.green, linewidth=2)
plot(lowPrice, title="First 5m Low", color=color.red, linewidth=2)
相关推荐