
概述
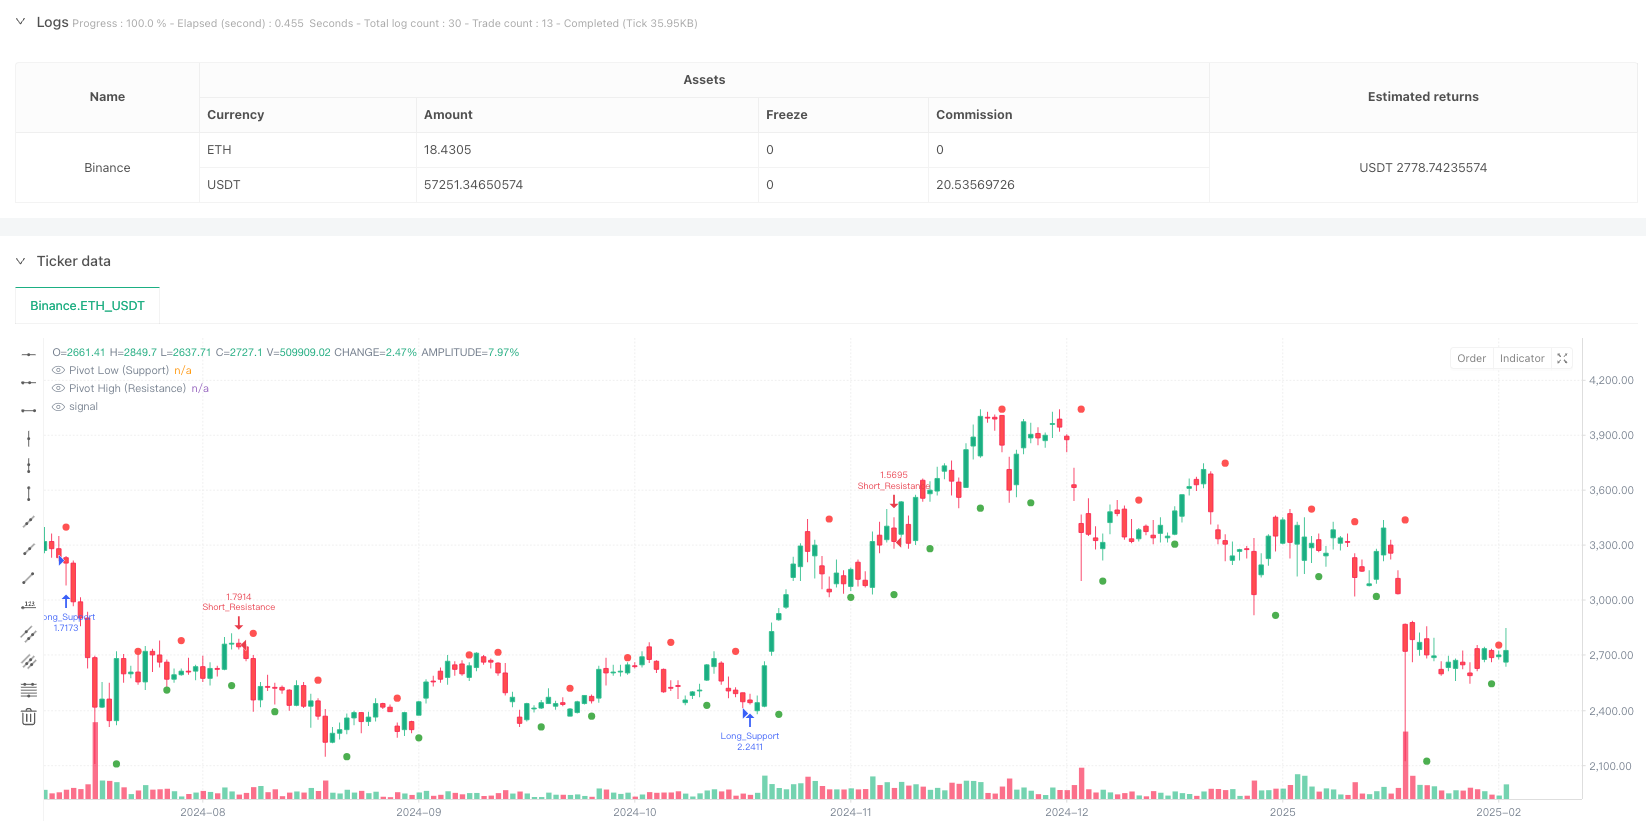
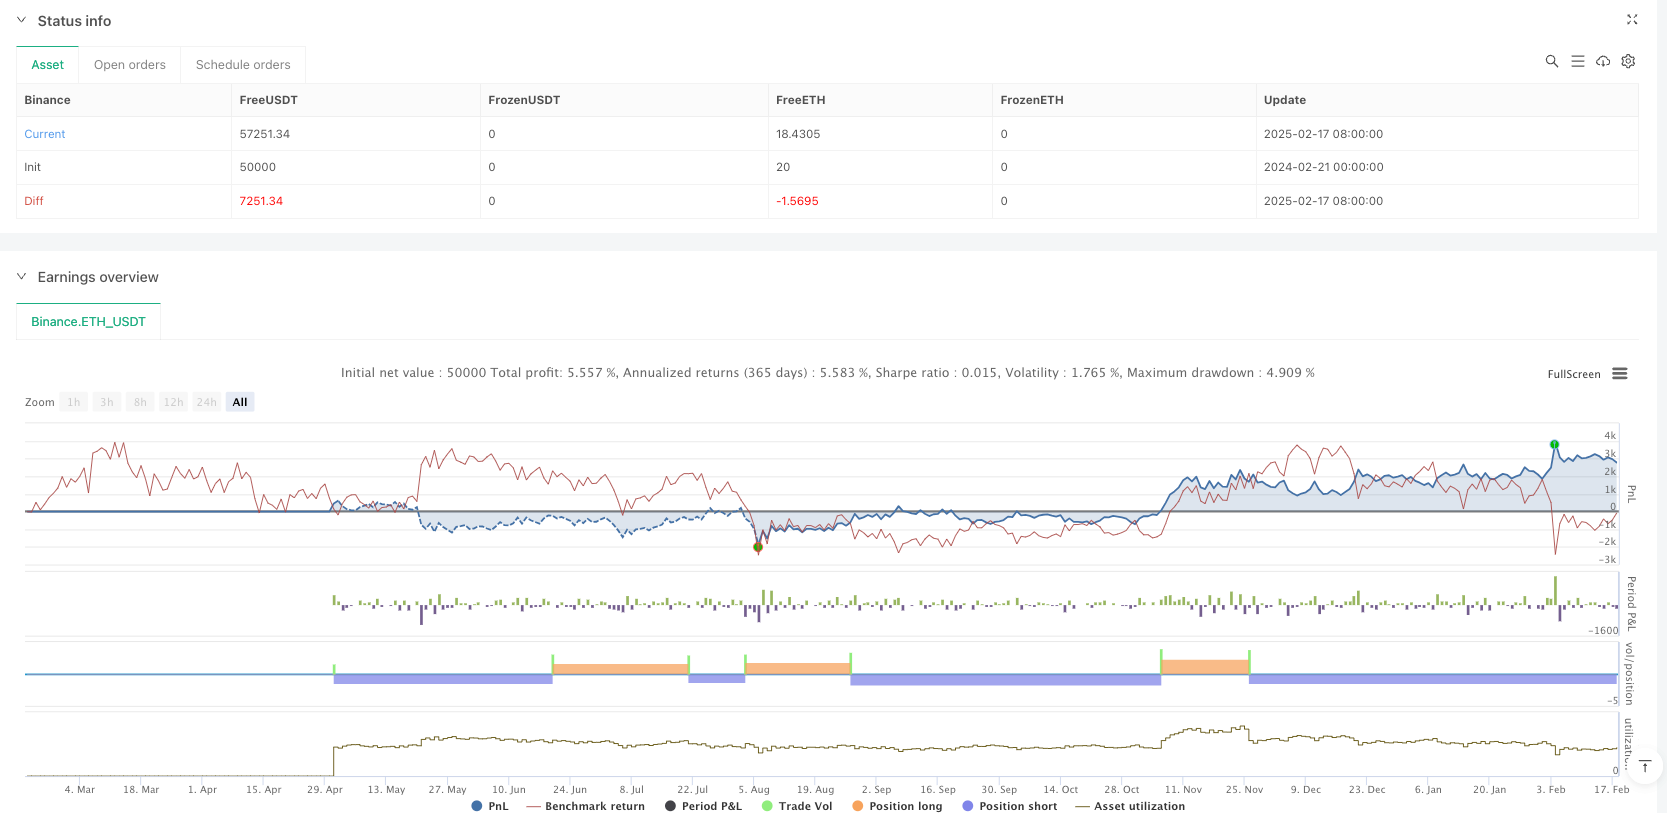
这是一个基于支撑阻力位突破和回测的量化交易策略。策略通过识别关键价格支撑位和阻力位,在价格突破后的回测确认点进行交易。该策略采用左右看回bar数动态定位关键点位,并结合回测容差来过滤假突破,从而提高交易的准确性和稳定性。
策略原理
策略主要包含以下核心逻辑: 1. 通过左右看回指定数量的K线来识别关键支撑和阻力pivot点位 2. 设置状态变量追踪候选支撑阻力位的突破和回测情况 3. 在出现新的pivot点时更新候选支撑阻力位 4. 当价格突破候选支撑阻力位且回测时进行交易: - 价格跌破支撑后回升至支撑位附近时做多 - 价格突破阻力后回落至阻力位附近时做空 5. 使用容差参数来过滤回测时的价格波动,提高信号质量
策略优势
- 采用经典的技术分析理论,逻辑清晰易懂
- 通过动态识别关键点位,适应性强
- 结合突破和回测双重确认,降低假信号
- 使用容差参数过滤噪音,提高准确率
- 代码结构清晰,易于维护和扩展
- 适用于多个时间周期和品种
策略风险
- 在震荡市场可能频繁交易导致亏损
- 突破假信号仍然存在
- 参数优化可能存在过拟合风险
- 市场波动过大时止损可能较大
- 需要考虑交易成本的影响
策略优化方向
- 增加趋势过滤器,只在主趋势方向交易
- 加入成交量确认机制
- 优化入场时机,可考虑增加技术指标确认
- 完善止损止盈机制
- 增加仓位管理逻辑
- 考虑加入多时间周期分析
总结
该策略通过经典的支撑阻力理论和突破回测逻辑构建,具有较好的理论基础。通过参数优化和风险控制可以获得稳定的交易效果。策略代码结构清晰,易于理解和扩展,具有较强的实用价值。建议在实盘交易中结合市场情况和个人风险偏好进行适当的参数调整。
策略源码
/*backtest
start: 2024-02-21 00:00:00
end: 2025-02-18 08:00:00
period: 1d
basePeriod: 1d
exchanges: [{"eid":"Binance","currency":"ETH_USDT"}]
*/

//@version=5
strategy("SR Breakout & Retest Strategy (4hr)", overlay=true, initial_capital=10000, default_qty_type=strategy.percent_of_equity, default_qty_value=10)

// ===== USER INPUTS =====
leftBars    = input.int(3, "Left Pivot Bars", minval=1)
rightBars   = input.int(3, "Right Pivot Bars", minval=1)
tolerance   = input.float(0.005, "Retest Tolerance (Fraction)", step=0.001)

// ===== PIVOT CALCULATION =====
pLow  = ta.pivotlow(low, leftBars, rightBars)
pHigh = ta.pivothigh(high, leftBars, rightBars)

// ===== STATE VARIABLES FOR CANDIDATE LEVELS =====
var float candidateSupport  = na
var bool  supportBroken     = false
var bool  supportRetested   = false

var float candidateResistance = na
var bool  resistanceBroken    = false
var bool  resistanceRetested  = false

// ===== UPDATE CANDIDATE LEVELS =====
if not na(pLow)
    candidateSupport := pLow
    supportBroken    := false
    supportRetested  := false

if not na(pHigh)
    candidateResistance := pHigh
    resistanceBroken    := false
    resistanceRetested  := false

// ===== CHECK FOR BREAKOUT & RETEST =====
// -- Support: Price breaks below candidate support and then retests it --
if not na(candidateSupport)
    if not supportBroken and low < candidateSupport
        supportBroken := true

    if supportBroken and not supportRetested and close >= candidateSupport and math.abs(low - candidateSupport) <= candidateSupport * tolerance
        supportRetested := true
        label.new(bar_index, candidateSupport, "Support Retest",
                  style=label.style_label_up, color=color.green, textcolor=color.white, size=size.tiny)
        // Example trading logic: Enter a long position on support retest
        strategy.entry("Long_Support", strategy.long)

// -- Resistance: Price breaks above candidate resistance and then retests it --
if not na(candidateResistance)
    if not resistanceBroken and high > candidateResistance
        resistanceBroken := true

    if resistanceBroken and not resistanceRetested and close <= candidateResistance and math.abs(high - candidateResistance) <= candidateResistance * tolerance
        resistanceRetested := true
        label.new(bar_index, candidateResistance, "Resistance Retest",
                  style=label.style_label_down, color=color.red, textcolor=color.white, size=size.tiny)
        // Example trading logic: Enter a short position on resistance retest
        strategy.entry("Short_Resistance", strategy.short)

// ===== PLOTTING =====
plot(pLow, title="Pivot Low (Support)", style=plot.style_circles, color=color.green, linewidth=2)
plot(pHigh, title="Pivot High (Resistance)", style=plot.style_circles, color=color.red, linewidth=2)
相关推荐