
Overview
This strategy is a quantitative trading system that combines multiple technical indicators, integrating Moving Averages (MA), Relative Strength Index (RSI), and Moving Average Convergence Divergence (MACD) to construct a comprehensive trading signal system. The strategy combines trend following with momentum identification, ensuring both directional accuracy and optimal entry timing. It also incorporates risk control mechanisms including stop-loss, take-profit, and trailing stop, forming a systematic trading approach.
Strategy Principles
The strategy builds trading signals based on three levels:
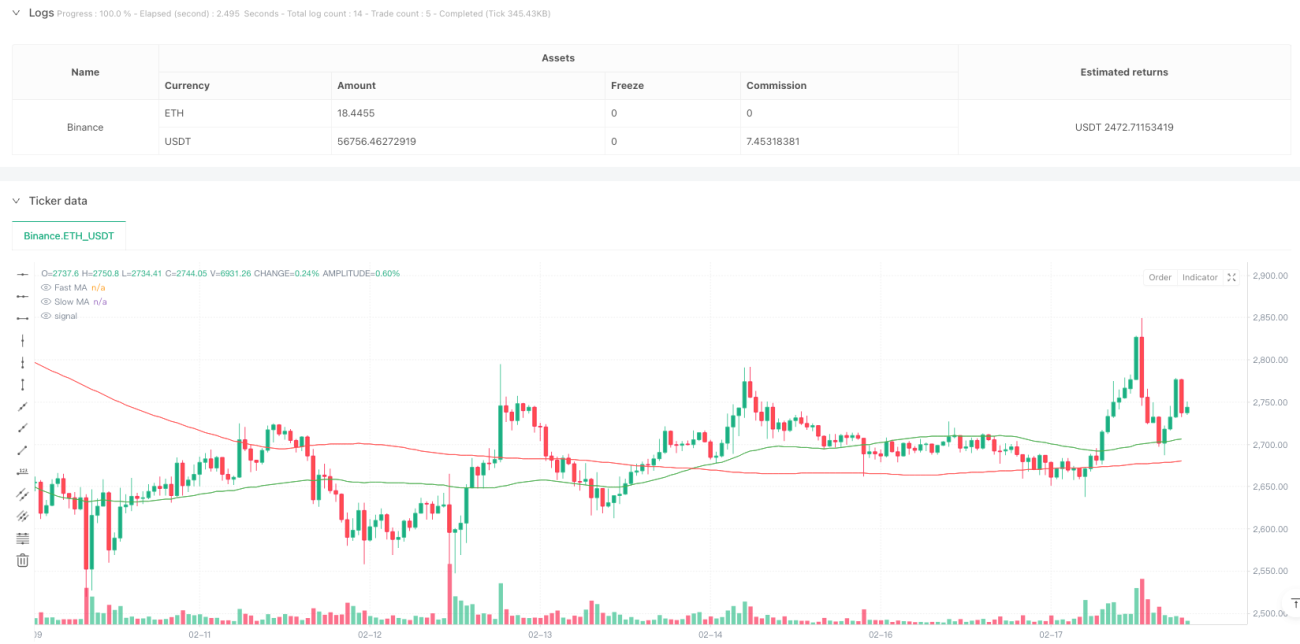
- Trend Determination: Uses 50-day and 200-day moving averages system to identify major trends through golden/death crosses
- Momentum Confirmation: Combines RSI overbought/oversold levels (70/30) with MACD crossovers to verify price momentum
- Risk Control: Implements 2% stop-loss, 4% take-profit, and 1% trailing stop to establish a complete risk management system
Specifically, long signals are generated when the fast MA (50-day) crosses above the slow MA (200-day), while RSI is below overbought levels and MACD forms a golden cross. Conversely, short signals occur with death crosses, RSI below oversold levels, and MACD death crosses.
Strategy Advantages
- High Signal Reliability: Multiple indicator cross-validation effectively filters false signals
- Accurate Trend Capture: Classical dual MA system effectively captures major trends
- Comprehensive Risk Control: Multiple stop-loss methods effectively control downside risk
- Strong Adaptability: Strategy parameters are highly adjustable to different market conditions
- Clear Execution: Clear signal generation conditions avoid subjective judgment interference
Strategy Risks
- Lag Risk: Moving averages inherently lag, potentially missing optimal entry points
- Sideways Market Risk: May generate frequent false breakout signals in ranging markets
- Parameter Optimization Risk: Over-optimization may lead to overfitting, affecting strategy stability
- Cost Control Risk: Frequent trading may incur high transaction costs
- Market Environment Dependency: Strategy performs better in trending markets but may underperform in other conditions
Strategy Optimization Directions
- Incorporate Volume Indicators: Add volume confirmation to existing signal system
- Optimize Parameter Adaptation: Develop dynamic parameter adjustment mechanisms
- Add Market Sentiment Indicators: Introduce VIX and other sentiment indicators
- Enhance Stop-Loss Mechanism: Develop more flexible stop-loss solutions like ATR-based stops
- Add Volatility Filters: Adjust positions in high volatility environments
Summary
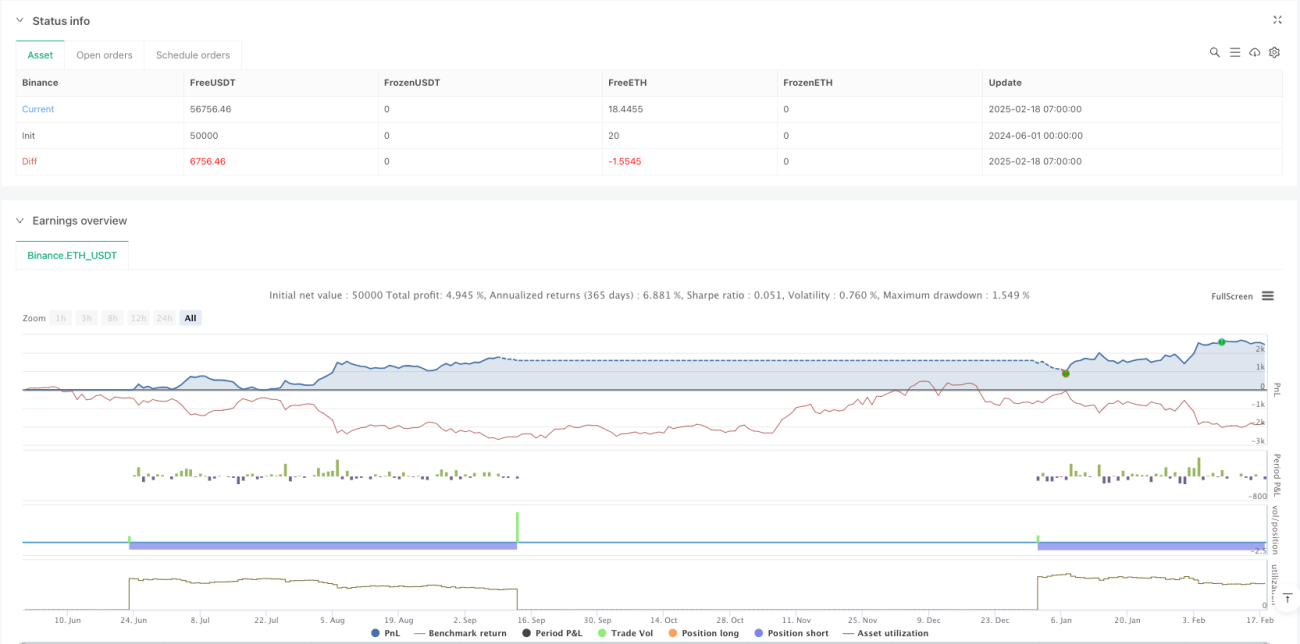
This strategy constructs a relatively complete trading system through the synergy of multiple technical indicators. It performs well in trending markets but requires optimization based on actual market conditions. Traders should conduct thorough backtesting before live implementation and adjust parameters according to their risk tolerance. The core advantages lie in its systematic signal generation mechanism and comprehensive risk control system, making it valuable for practical application.
- 1