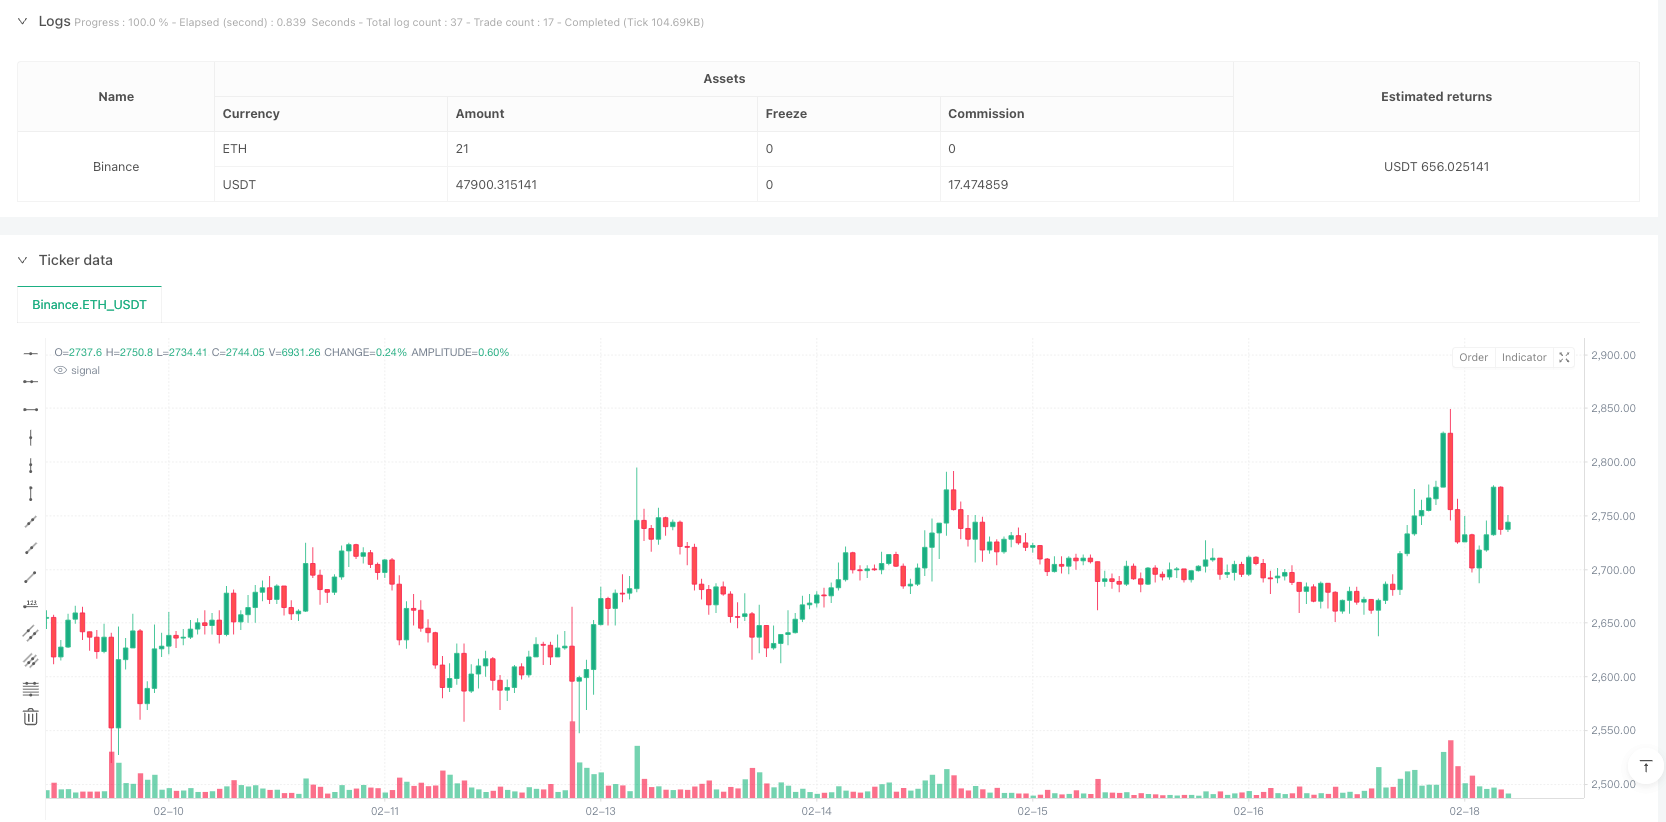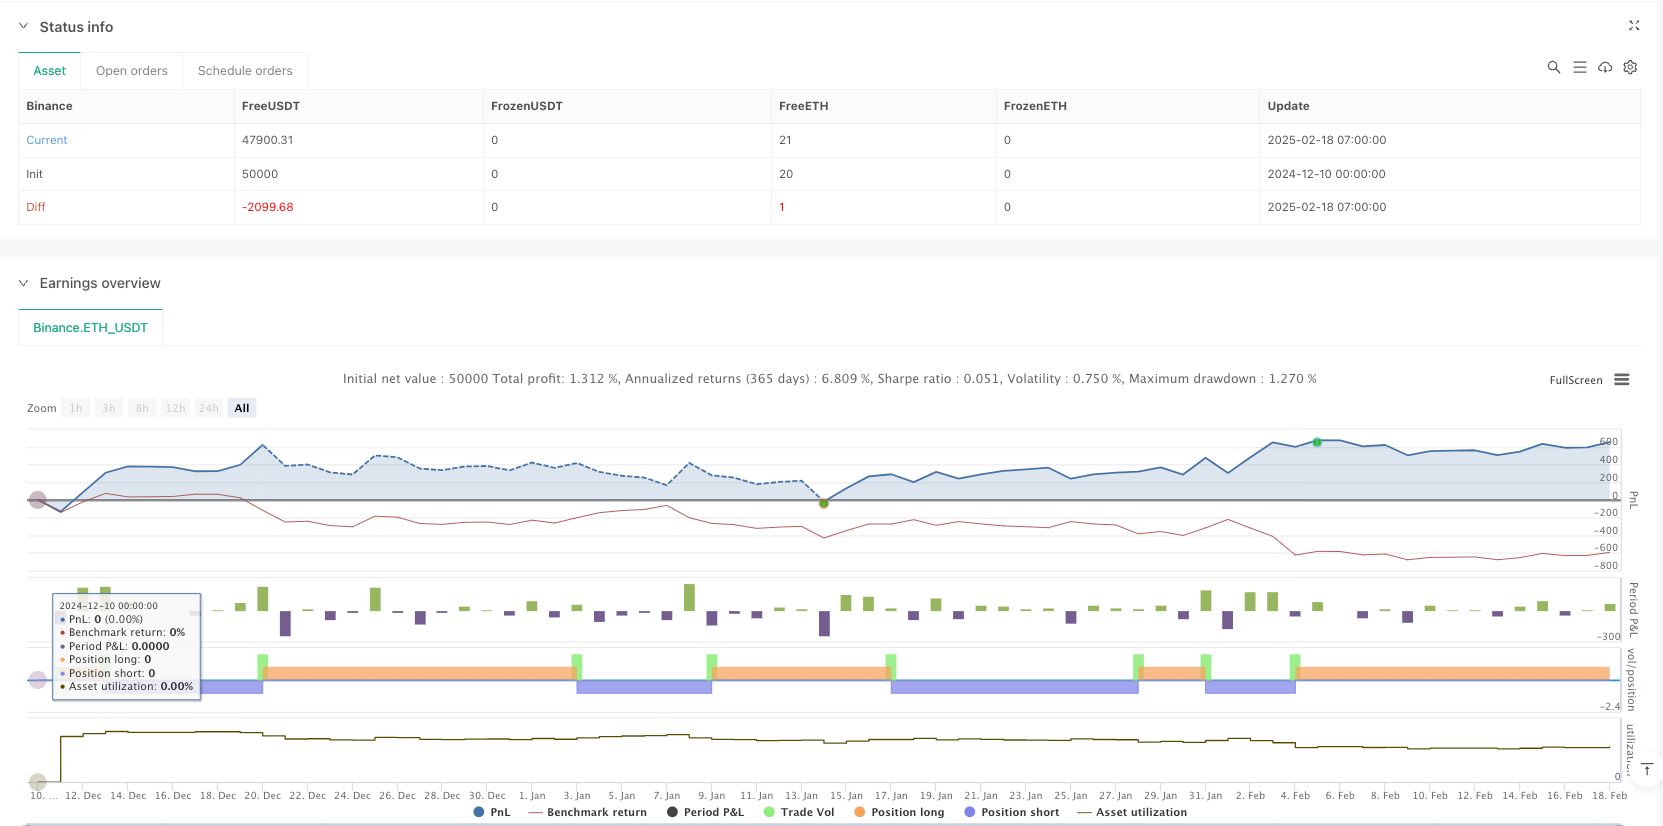

概述
本策略是一个基于多重技术指标协同分析的交易信号生成系统。策略整合了相对强弱指数(RSI)、布林带(BB)、日内动量指数(IMI)和资金流量指数(MFI)四个经典技术指标,通过指标间的交叉验证来产生更可靠的交易信号。策略设计上特别适配4小时时间周期,并根据信号强度划分为常规信号和强信号两个等级。
策略原理
策略的核心逻辑是通过多指标的协同配合来确认交易信号。具体来说: 1. 买入信号触发条件: - RSI低于30,表明市场超卖 - 价格低于布林带下轨,显示价格偏离度较大 - IMI低于30,表明日内下跌动能减弱 - MFI低于20,表明资金流出压力减轻 2. 卖出信号触发条件: - RSI高于70,表明市场超买 - 价格高于布林带上轨,显示价格偏离度较大 - IMI高于70,表明日内上涨动能减弱 - MFI高于80,表明资金流入压力减轻 3. 强信号条件在常规信号的基础上进一步收紧阈值要求
策略优势
- 多重技术指标交叉验证,显著提高信号可靠性
- 区分常规信号和强信号,便于灵活调整仓位
- 策略逻辑清晰简单,便于理解和维护
- 指标参数可调,适应性强
- 集成回测功能,便于策略优化
策略风险
- 多指标协同可能导致信号滞后 解决方案:适当放宽触发条件,或引入趋势预判指标
- 固定阈值在不同市场环境下可能不适用 解决方案:引入自适应阈值机制
- 4小时周期可能错过短期机会 解决方案:增加多时间周期分析
策略优化方向
- 引入自适应阈值机制 通过计算指标的历史分位数来动态调整信号阈值,提高策略适应性
- 增加趋势强度过滤 引入ADX等趋势强度指标,过滤震荡市场中的虚假信号
- 优化仓位管理 根据信号强度和市场波动率动态调整持仓比例
- 加入止损止盈机制 设置基于ATR的动态止损止盈位
总结
该策略通过多个经典技术指标的协同分析,构建了一个相对可靠的交易信号生成系统。策略设计注重实用性和可维护性,同时预留了充分的优化空间。通过合理的参数调整和优化方向的实施,策略有望在实际交易中取得稳定表现。
策略源码
/*backtest
start: 2024-12-10 00:00:00
end: 2025-02-18 08:00:00
period: 1h
basePeriod: 1h
exchanges: [{"eid":"Binance","currency":"ETH_USDT"}]
*/

//@version=5
strategy("Clear Buy/Sell Signals with RSI, Bollinger Bands, IMI, and MFI", overlay=true)

// Input parameters
rsiLength = input.int(14, title="RSI Length")
bbLength = input.int(20, title="Bollinger Bands Length")
bbStdDev = input.float(2.0, title="Bollinger Bands Std Dev")
imiLength = input.int(14, title="IMI Length")
mfiLength = input.int(14, title="MFI Length")

// RSI Calculation
rsi = ta.rsi(close, rsiLength)

// Bollinger Bands Calculation
[bbUpper, bbMiddle, bbLower] = ta.bb(close, bbLength, bbStdDev)

// Intraday Momentum Index (IMI) Calculation
upSum = math.sum(close > open ? close - open : 0, imiLength)
downSum = math.sum(close < open ? open - close : 0, imiLength)
imi = (upSum / (upSum + downSum)) * 100

// Money Flow Index (MFI) Calculation
typicalPrice = (high + low + close) / 3
mfi = ta.mfi(typicalPrice, mfiLength)

// Buy/Sell Conditions
buyCondition = rsi < 30 and close < bbLower and imi < 30 and mfi < 20
sellCondition = rsi > 70 and close > bbUpper and imi > 70 and mfi > 80

// Strong Buy/Sell Conditions
strongBuyCondition = rsi < 20 and close < bbLower and imi < 20 and mfi < 10
strongSellCondition = rsi > 80 and close > bbUpper and imi > 80 and mfi > 90

// Plot Buy/Sell Signals
plotshape(series=buyCondition, title="Buy Signal", location=location.belowbar, color=color.green, style=shape.labelup, text="BUY", size=size.small)
plotshape(series=sellCondition, title="Sell Signal", location=location.abovebar, color=color.red, style=shape.labeldown, text="SELL", size=size.small)

// Plot Strong Buy/Sell Signals
plotshape(series=strongBuyCondition, title="Strong Buy Signal", location=location.belowbar, color=color.lime, style=shape.labelup, text="STRONG BUY", size=size.normal)
plotshape(series=strongSellCondition, title="Strong Sell Signal", location=location.abovebar, color=color.red, style=shape.labeldown, text="STRONG SELL", size=size.normal)

// Strategy Logic (for Backtesting)
if (buyCondition or strongBuyCondition)
    strategy.entry("Buy", strategy.long)
if (sellCondition or strongSellCondition)
    strategy.entry("Sell", strategy.short)
相关推荐