
概述
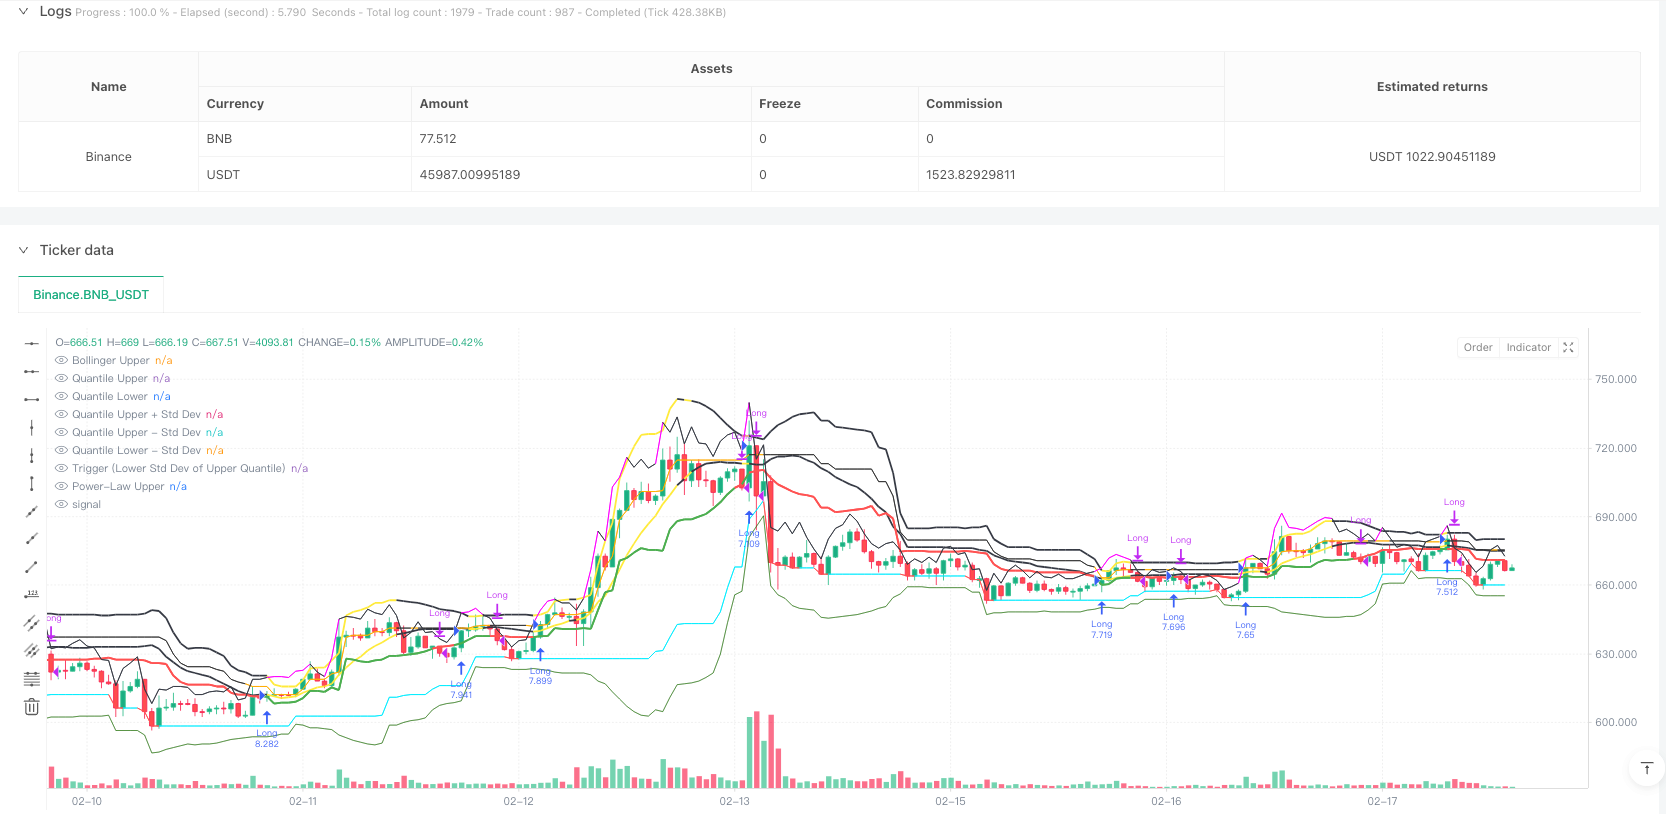
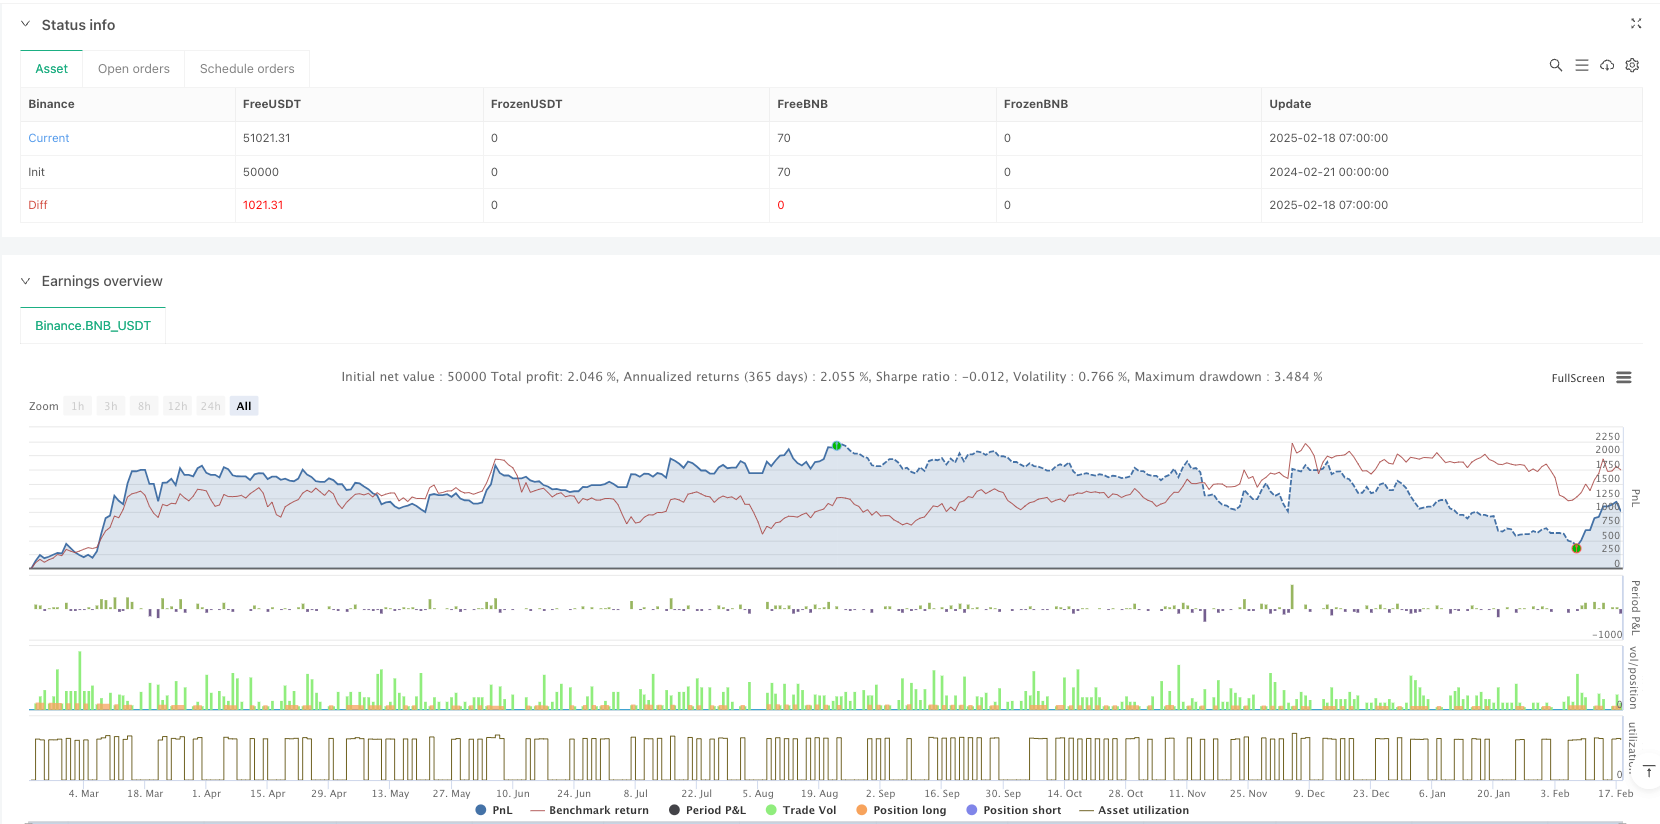
这是一个基于多重统计带和趋势分析的交易策略。该策略结合使用布林带、分位数带和幂律带来识别关键支撑/阻力区域,并利用上分位数带的下标准差线作为触发信号来确定入场和出场时机。策略设计充分考虑了市场波动性,通过多重统计方法的叠加来提高信号的可靠性。
策略原理
策略的核心原理是通过多重统计带的交叉来捕捉市场趋势。主要包含以下几个关键组成部分: 1. 布林带系统 - 用于判断价格波动区间,当价格突破上轨时转为黄色预警。 2. 分位数带系统 - 计算价格的上下分位数,用于评估价格的极值概率。 3. 幂律带系统 - 基于历史回报计算显著性水平,用于衡量超买超卖。 4. 触发系统 - 以上分位数带的下标准差线作为主要触发信号,价格维持在该线以上视为看涨信号。 5. 确认系统 - 通过设置连续确认K线数来过滤虚假信号。
策略优势
- 信号稳定性强 - 多重统计带的叠加使用能有效降低虚假信号。
- 适应性好 - 策略可以适应不同的时间周期和市场条件。
- 风险控制完善 - 通过多重统计带来划分风险区域,同时设有止损机制。
- 参数灵活 - 提供丰富的参数选项,可根据不同市场特征进行优化。
- 可视化清晰 - 各类指标线条颜色区分明显,交易信号直观。
策略风险
- 滞后性风险 - 统计指标都具有一定滞后性,可能错过最佳入场点。
- 震荡市不利 - 在横盘震荡市场中可能产生过多交易信号。
- 参数敏感性 - 不同参数组合的效果差异较大,需要反复优化。
- 计算负荷大 - 多重统计指标的实时计算需要较大计算资源。
- 市场环境依赖 - 在极端市场环境下统计规律可能失效。
策略优化方向
- 引入动态参数 - 根据市场波动率自动调整各项参数。
- 增加市场环境判断 - 添加趋势强度指标来过滤震荡市信号。
- 优化计算效率 - 简化部分计算过程,减少资源占用。
- 完善风险控制 - 加入更多止损条件和仓位管理策略。
- 增强适应性 - 开发自适应型参数优化系统。
总结
这是一个融合多种统计方法的综合性趋势跟踪策略。通过布林带、分位数带和幂律带的协同作用,能够较好地把握市场趋势,同时具备良好的风险控制能力。虽然存在一定的滞后性和参数优化难度,但通过持续改进和优化,该策略具有较好的实用价值和发展前景。
策略源码
/*backtest
start: 2024-02-21 00:00:00
end: 2025-02-18 08:00:00
period: 1h
basePeriod: 1h
exchanges: [{"eid":"Binance","currency":"BNB_USDT"}]
*/

//@version=6
strategy("Multi-Band Comparison Strategy with Separate Entry/Exit Confirmation", overlay=true,
         default_qty_type=strategy.percent_of_equity, default_qty_value=10,
         initial_capital=5000, currency=currency.USD)

// === Inputs ===

// Basic Parameters
length         = input.int(20, "Length (SMA)", minval=1)
boll_mult      = input.float(1.0, "Bollinger Band Multiplier", minval=0.1, step=0.1)
upper_quantile = input.float(0.95, "Upper Quantile (0.0-1.0)", minval=0.0, maxval=1.0)
lower_quantile = input.float(0.05, "Lower Quantile (0.0-1.0)", minval=0.0, maxval=1.0)

// Separate confirmation inputs
entry_confirmBars = input.int(1, "Entry Confirmation Bars", minval=1, tooltip="Number of consecutive bars the entry condition must hold")
exit_confirmBars  = input.int(1, "Exit Confirmation Bars",  minval=1, tooltip="Number of consecutive bars the exit condition must hold")

// Toggle Visibility for Bands
show_lower_boll  = input.bool(false, "Show Lower Bollinger Band", tooltip="Enable or disable the lower Bollinger Band")
show_upper_boll  = input.bool(true,  "Show Upper Bollinger Band", tooltip="Enable or disable the upper Bollinger Band")
show_lower_quant = input.bool(true, "Show Lower Quantile Band", tooltip="Enable or disable the lower Quantile Band")
show_upper_quant = input.bool(true,  "Show Upper Quantile Band", tooltip="Enable or disable the upper Quantile Band")
show_upper_power = input.bool(true,  "Show Upper Power-Law Band", tooltip="Enable or disable the upper Power-Law Band")
show_lower_power = input.bool(false, "Show Lower Power-Law Band", tooltip="Enable or disable the lower Power-Law Band")
show_quant_std   = input.bool(true,  "Show Standard Deviation around Quantile Bands", tooltip="Enable or disable standard deviation lines around Quantile Bands")

// Individual Toggles for Std Dev Lines
show_upper_quant_std_up   = input.bool(true,  "Show Upper Quantile + Std Dev", tooltip="Enable or disable the Upper Quantile + Std Dev line")
show_upper_quant_std_down = input.bool(true,  "Show Upper Quantile - Std Dev", tooltip="Enable or disable the Upper Quantile - Std Dev line")
show_lower_quant_std_up   = input.bool(false, "Show Lower Quantile + Std Dev", tooltip="Enable or disable the Lower Quantile + Std Dev line")
show_lower_quant_std_down = input.bool(true,  "Show Lower Quantile - Std Dev", tooltip="Enable or disable the Lower Quantile - Std Dev line")

// Moving Average Toggles
show_ema = input.bool(false, "Show EMA", tooltip="Enable or disable the Exponential Moving Average")
show_sma = input.bool(false, "Show SMA", tooltip="Enable or disable the Simple Moving Average")

// EMA Parameters
ema_length = input.int(50, minval=1, title="EMA Length")
ema_source = input.source(close, title="EMA Source")

// === Data Handling ===

// Create persistent arrays to store data
var float[] data_array   = array.new_float()
var float[] return_array = array.new_float()

// Update the data array with the latest close prices
if array.size(data_array) < length
    array.push(data_array, close)
else
    array.shift(data_array)
    array.push(data_array, close)

// Update the return array with the latest returns
returns = close / close[1] - 1
if array.size(return_array) < length
    array.push(return_array, returns)
else
    array.shift(return_array)
    array.push(return_array, returns)

// === Helper Function ===

// Function to calculate a custom percentile
f_percentile(arr, quantile) =>
    arr_sorted = array.copy(arr)
    array.sort(arr_sorted, order.ascending)
    index = math.round((array.size(arr_sorted) - 1) * quantile)
    array.get(arr_sorted, index)

// === Calculations ===

// Bollinger Bands Calculation
sma        = ta.sma(close, length)
stdev      = ta.stdev(close, length)
boll_upper = sma + boll_mult * stdev
boll_lower = sma - boll_mult * stdev

// Power-Law Bands Calculation
var float power_upper = na
var float power_lower = na
if array.size(return_array) == length
    power_upper := f_percentile(return_array, upper_quantile)
    power_lower := f_percentile(return_array, lower_quantile)
var float power_upper_band = na
var float power_lower_band = na
if not na(power_upper) and not na(power_lower)
    power_upper_band := close * (1 + power_upper)
    power_lower_band := close * (1 + power_lower)

// Quantile Bands Calculation
var float quant_upper = na
var float quant_lower = na
if array.size(data_array) == length
    quant_upper := f_percentile(data_array, upper_quantile)
    quant_lower := f_percentile(data_array, lower_quantile)

// Standard Deviation around Quantile Bands
quant_upper_std_up   = quant_upper + stdev
quant_upper_std_down = quant_upper - stdev
quant_lower_std_up   = quant_lower + stdev
quant_lower_std_down = quant_lower - stdev

// === Color Calculations ===

// For the upper Bollinger band, color it yellow when price is above it, black otherwise.
upper_boll_color = close > boll_upper ? color.yellow : color.black

// The entry/exit trigger is based on the lower std dev band of the upper quantile band.
// It "turns green" (i.e. favorable for entry) when the price is above this level,
// and "turns red" (i.e. unfavorable, triggering an exit) when price is below it.
triggerCondition = close > quant_upper_std_down

// For plotting purposes, define the color of the lower std dev band of the upper quantile band:
triggerColor = triggerCondition ? color.green : color.red

// (Other color definitions remain for the additional bands.)
upper_power_color = (not na(power_upper_band) and not na(quant_upper_std_up) and power_upper_band > quant_upper_std_up) ? color.new(#FF00FF, 0) : color.black
upper_quant_color = (not na(quant_upper) and not na(power_upper_band) and power_upper_band > quant_upper) ? color.new(#FFAE00, 0) : color.rgb(50, 50, 50)
upper_quant_std_down_color = (not na(quant_upper_std_down) and close > quant_upper_std_down) ? color.green : color.red
lower_quant_std_down_color = (not na(quant_lower_std_down) and close > quant_lower_std_down) ? color.rgb(24, 113, 0, 44) : color.red
lower_quant_color = (ta.cross(close, quant_lower) or close == quant_lower) ? color.red : color.rgb(0, 238, 255)

// For demonstration, a variable to toggle a color on the Bollinger crossover.
var color upper_quant_std_up_color = color.black
if ta.crossover(close, boll_upper)
    upper_quant_std_up_color := color.yellow
if ta.crossunder(close, boll_upper)
    upper_quant_std_up_color := color.black

// === Confirmation Bars Logic with Separate Counters Based on Trigger Condition ===

// Use the trigger condition (based on the lower std dev band of the upper quantile band)
// for entry/exit confirmation.
var int entryCounter = 0
var int exitCounter  = 0

// When triggerCondition is true (price above quant_upper_std_down) the "green" state holds.
entryCounter := triggerCondition ? entryCounter + 1 : 0
// When triggerCondition is false (price below quant_upper_std_down) the "red" state holds.
exitCounter  := not triggerCondition ? exitCounter + 1 : 0

// === Strategy Orders ===

// Enter long when triggerCondition has been true for at least entry_confirmBars bars and no position is active.
if (entryCounter >= entry_confirmBars) and (strategy.position_size <= 0)
    strategy.entry("Long", strategy.long)

// Exit long when triggerCondition has been false for at least exit_confirmBars bars and a long position is active.
if (exitCounter >= exit_confirmBars) and (strategy.position_size > 0)
    strategy.close("Long")

// === Plotting ===

// Plot Bollinger Bands
plot(show_upper_boll ? boll_upper : na, color=upper_boll_color, title="Bollinger Upper", linewidth=2)
plot(show_lower_boll ? boll_lower : na, color=color.red, title="Bollinger Lower", linewidth=1)

// Plot Power-Law Bands
plot(show_upper_power ? power_upper_band : na, color=upper_power_color, title="Power-Law Upper", linewidth=1)
plot(show_lower_power ? power_lower_band : na, color=color.rgb(255, 59, 248), title="Power-Law Lower", linewidth=1)

// Plot Quantile Bands
plot(show_upper_quant ? quant_upper : na, color=upper_quant_color, title="Quantile Upper", linewidth=1)
plot(show_lower_quant ? quant_lower : na, color=lower_quant_color, title="Quantile Lower", linewidth=1)

// Plot Standard Deviation around Quantile Bands
plot(show_quant_std and show_upper_quant and show_upper_quant_std_up ? quant_upper_std_up : na, color=upper_quant_std_up_color, title="Quantile Upper + Std Dev", linewidth=2)
plot(show_quant_std and show_upper_quant and show_upper_quant_std_down ? quant_upper_std_down : na, color=upper_quant_std_down_color, title="Quantile Upper - Std Dev", linewidth=2)
plot(show_quant_std and show_lower_quant and show_lower_quant_std_up ? quant_lower_std_up : na, color=color.green, title="Quantile Lower + Std Dev", linewidth=1)
plot(show_quant_std and show_lower_quant and show_lower_quant_std_down ? quant_lower_std_down : na, color=lower_quant_std_down_color, title="Quantile Lower - Std Dev", linewidth=1)

// Also plot the trigger line (lower std dev band of upper quantile band) with its own color
plot(show_quant_std ? quant_upper_std_down : na, color=triggerColor, title="Trigger (Lower Std Dev of Upper Quantile)", linewidth=2)

// Plot SMA for reference
plot(show_sma ? sma : na, color=color.rgb(0, 24, 132), title="SMA", linewidth=3)

// Plot EMA for reference
ema_value = ta.ema(ema_source, ema_length)
plot(show_ema ? ema_value : na, color=color.rgb(147, 0, 0), title="EMA", linewidth=2)
相关推荐