
概述
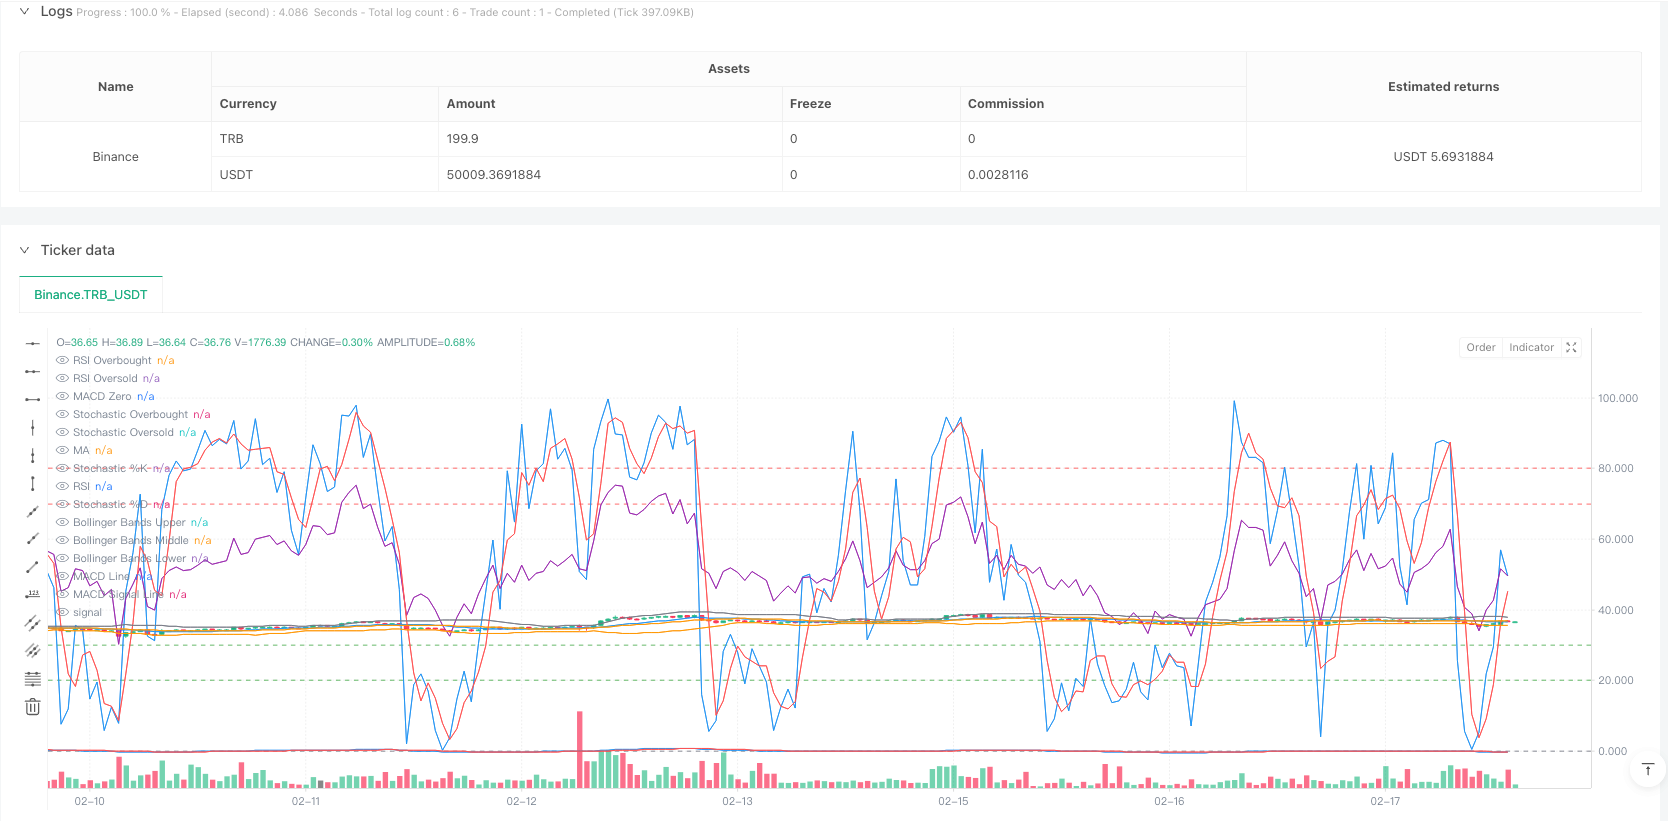
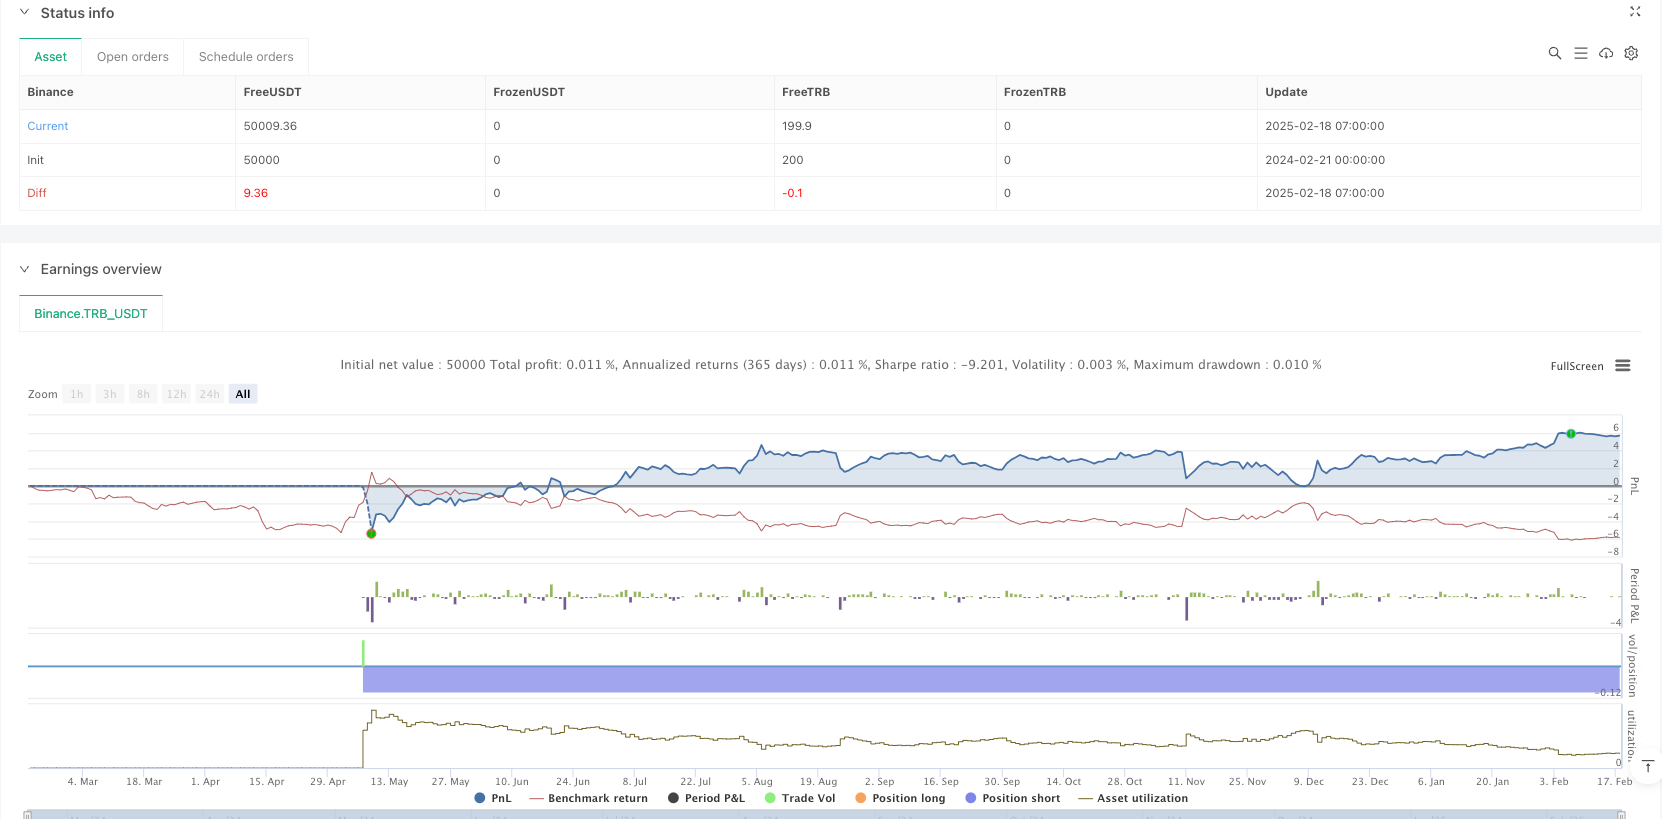
该策略是一个基于多重技术指标的趋势跟踪交易系统,整合了移动平均线(MA)、相对强弱指标(RSI)、布林带(BB)、移动平均线趋散指标(MACD)和随机指标(Stochastic)等多个技术指标,通过指标间的交叉确认来识别市场趋势和交易机会。策略采用百分比仓位管理方式,默认使用1%的资金进行每次交易。
策略原理
策略通过以下几个维度来确定交易信号: 1. 使用14周期简单移动平均线(SMA)作为趋势指示基准 2. RSI指标用于判断超买超卖,设定30和70为关键阈值 3. 布林带通道用于确定价格波动区间,期间为20 4. MACD指标(12,26,9)用于趋势确认 5. 随机指标(14,3)用于动量判断
做多条件需同时满足: - RSI低于30(超卖) - MACD线上穿信号线 - 随机K值低于20 - 收盘价高于布林带中轨 - 前一根收盘价低于布林带下轨
做空条件需同时满足: - RSI高于70(超买) - MACD线下穿信号线 - 随机K值高于80 - 收盘价低于布林带中轨 - 前一根收盘价高于布林带上轨
策略优势
- 多重技术指标交叉确认,能有效过滤虚假信号
- 结合趋势跟踪和震荡指标,兼顾趋势和反转行情
- 采用百分比持仓管理,有效控制风险
- 指标参数可调,具有良好的适应性
- 交易信号清晰,易于执行和回测
策略风险
- 多重指标可能导致信号滞后,影响入场时机
- 震荡市中可能频繁交易,增加成本
- 固定参数在不同市场环境下表现不一
- 技术指标之间可能相互矛盾,造成信号混乱 建议采取以下措施规避风险:
- 根据不同市场特征动态调整参数
- 设置止损止盈以控制风险
- 结合成交量等其他指标进行信号确认
- 定期评估策略表现并及时调整
策略优化方向
- 引入自适应参数机制,根据市场波动性动态调整指标参数
- 加入成交量指标作为辅助确认
- 优化持仓管理,考虑分批建仓和减仓
- 增加市场环境识别模块,在不同行情下采用不同策略
- 引入机器学习算法优化信号生成逻辑
总结
该策略通过多重技术指标的综合运用,建立了一个相对完整的趋势跟踪交易系统。策略具有信号可靠、风险可控的特点,但仍需要在实盘中根据市场情况不断优化参数和逻辑。通过持续改进和完善,该策略有望在不同市场环境下都能获得稳定收益。
策略源码
/*backtest
start: 2024-02-21 00:00:00
end: 2025-02-18 08:00:00
period: 1h
basePeriod: 1h
exchanges: [{"eid":"Binance","currency":"TRB_USDT"}]
*/

//@version=5
strategy("TradingBot Strategy", overlay=true, default_qty_type=strategy.percent_of_equity, default_qty_value=1)

// Input parameters
lotSize = input.float(0.1, title="Lot Size")
maPeriod = input.int(14, title="MA Period")
rsiPeriod = input.int(14, title="RSI Period")
bbPeriod = input.int(20, title="Bollinger Bands Period")
macdFast = input.int(12, title="MACD Fast EMA")
macdSlow = input.int(26, title="MACD Slow EMA")
macdSignal = input.int(9, title="MACD Signal SMA")
stochK = input.int(14, title="Stochastic %K")
stochD = input.int(3, title="Stochastic %D")

// Indicators
ma = ta.sma(close, maPeriod)
rsi = ta.rsi(close, rsiPeriod)
[bbUpper, bbMiddle, bbLower] = ta.bb(close, bbPeriod, 2)
[macdLine, signalLine, _] = ta.macd(close, macdFast, macdSlow, macdSignal)
k = ta.stoch(close, high, low, stochK)
d = ta.sma(k, stochD)

// Plot indicators
plot(ma, color=color.blue, title="MA", linewidth=1)
hline(70, "RSI Overbought", color=color.red)
hline(30, "RSI Oversold", color=color.green)
plot(rsi, color=color.purple, title="RSI", linewidth=1)
plot(bbUpper, color=color.orange, title="Bollinger Bands Upper", linewidth=1)
plot(bbMiddle, color=color.gray, title="Bollinger Bands Middle", linewidth=1)
plot(bbLower, color=color.orange, title="Bollinger Bands Lower", linewidth=1)
hline(0, "MACD Zero", color=color.gray)
plot(macdLine, color=color.blue, title="MACD Line", linewidth=1)
plot(signalLine, color=color.red, title="MACD Signal Line", linewidth=1)
hline(80, "Stochastic Overbought", color=color.red)
hline(20, "Stochastic Oversold", color=color.green)
plot(k, color=color.blue, title="Stochastic %K", linewidth=1)
plot(d, color=color.red, title="Stochastic %D", linewidth=1)

// Trading logic
longCondition = rsi < 30 and macdLine > signalLine and k < 20 and close > bbMiddle and close[1] < bbLower
shortCondition = rsi > 70 and macdLine < signalLine and k > 80 and close < bbMiddle and close[1] > bbUpper

if (longCondition)
    strategy.entry("Buy", strategy.long, qty=lotSize)
    label.new(bar_index, low, text="BUY", style=label.style_label_up, color=color.green, textcolor=color.white, size=size.small, yloc=yloc.belowbar)
if (shortCondition)
    strategy.entry("Sell", strategy.short, qty=lotSize)
    label.new(bar_index, high, text="SELL", style=label.style_label_down, color=color.red, textcolor=color.white, size=size.small, yloc=yloc.abovebar)
相关推荐