
Overview
This is an innovative multi-timeframe trading strategy that combines the Hurst Exponent and Fibonacci retracement levels. The strategy evaluates market trend characteristics by calculating the Hurst exponent across different timeframes and identifies potential trading opportunities using key Fibonacci price levels. It incorporates a strict risk management framework, including fixed risk ratios, target risk-reward ratios, and daily and overall trading frequency limits.
Strategy Principles
The core logic is based on two main components:
- Market trend assessment through Hurst exponent calculations on current and higher timeframes. A Hurst exponent above 0.5 indicates trend persistence, while below 0.5 suggests mean-reversion tendencies.
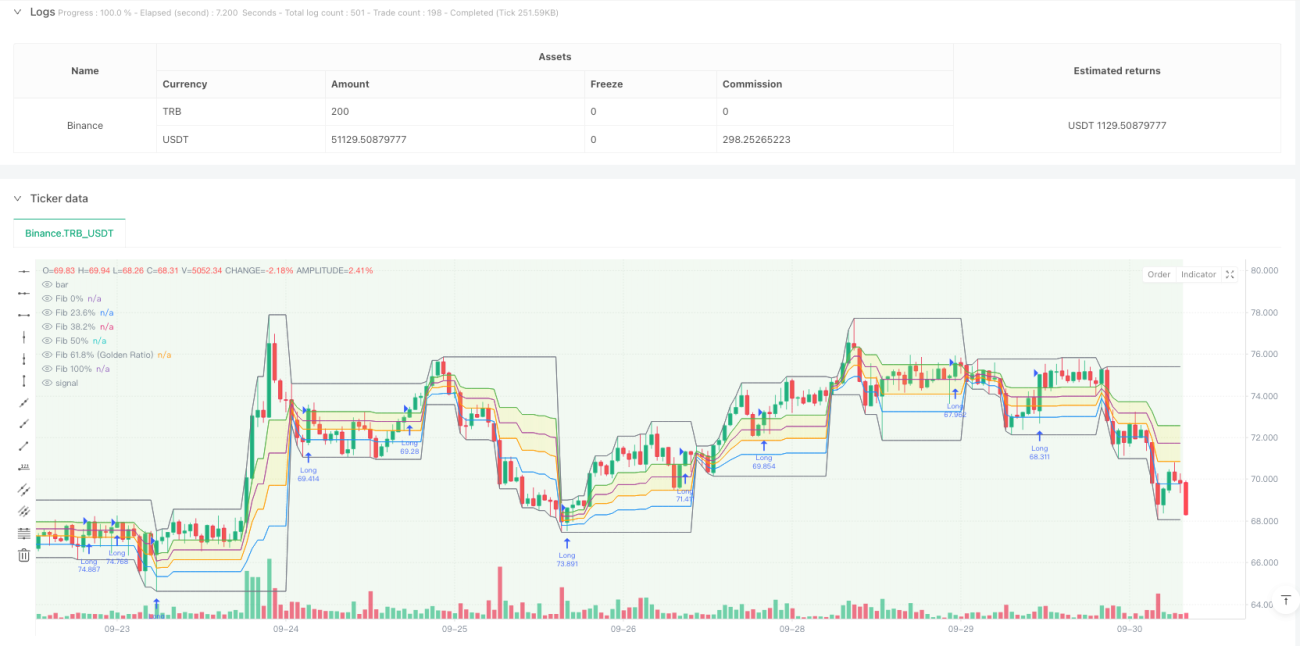
- Calculation of key Fibonacci retracement levels using daily highs and lows, focusing on the 61.8% (Golden Ratio) and 38.2% levels. Long signals are triggered when the daily Hurst exponent is above 0.5 and price breaks above the 61.8% level; short signals when the daily Hurst is below 0.5 and price breaks below the 38.2% level.
Strategy Advantages
- Multi-dimensional Analysis: Provides a comprehensive market perspective by combining trend analysis across timeframes with price levels
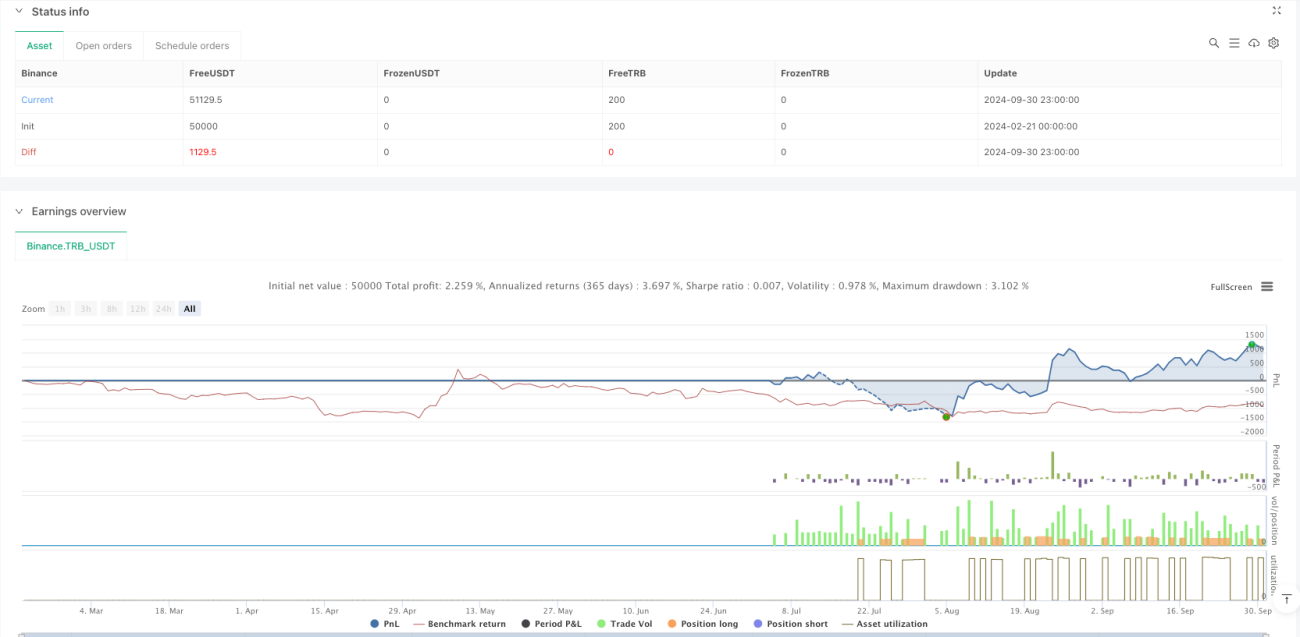
- Robust Risk Management: Implements a fixed risk percentage (2%) and target risk-reward ratio (1:2) framework
- Trading Frequency Control: Sets maximum daily and total trade limits to prevent overtrading
- Visual Aids: Offers real-time market trend background color changes and key indicator information table
Strategy Risks
- Market Environment Dependency: May underperform in ranging markets with unclear trends
- Parameter Sensitivity: Strategy performance depends on chosen Hurst calculation period and Fibonacci timeframe
- Slippage Impact: May face significant slippage risks in less liquid market conditions
- System Complexity: Multiple components increase the possibility of strategy failure
Optimization Directions
- Dynamic Parameter Adjustment: Implement automatic adjustment of Hurst calculation period based on market volatility
- Additional Filters: Introduce extra market state filters to improve signal quality
- Position Management Enhancement: Develop volatility-based dynamic position sizing
- Exit Mechanism Improvement: Design more flexible profit target setting methods
Summary
This strategy innovatively combines classical technical analysis tools with modern quantitative methods. Through multi-timeframe analysis and strict risk management, it maintains theoretical foundations while focusing on practical applicability. While there is room for optimization, the overall framework offers good extensibility and practical value.
- 1