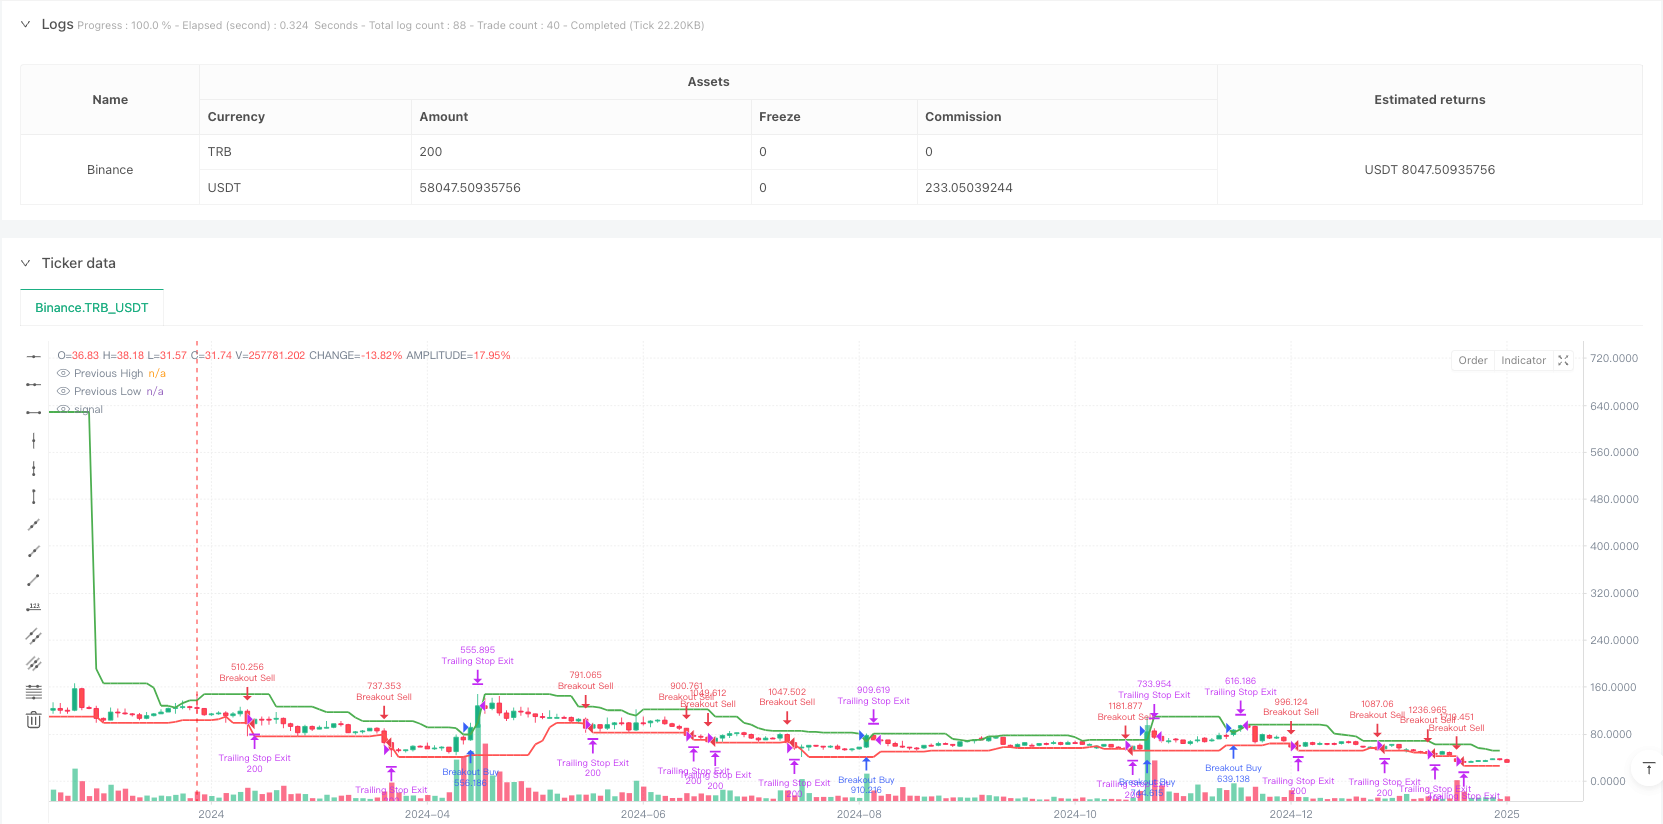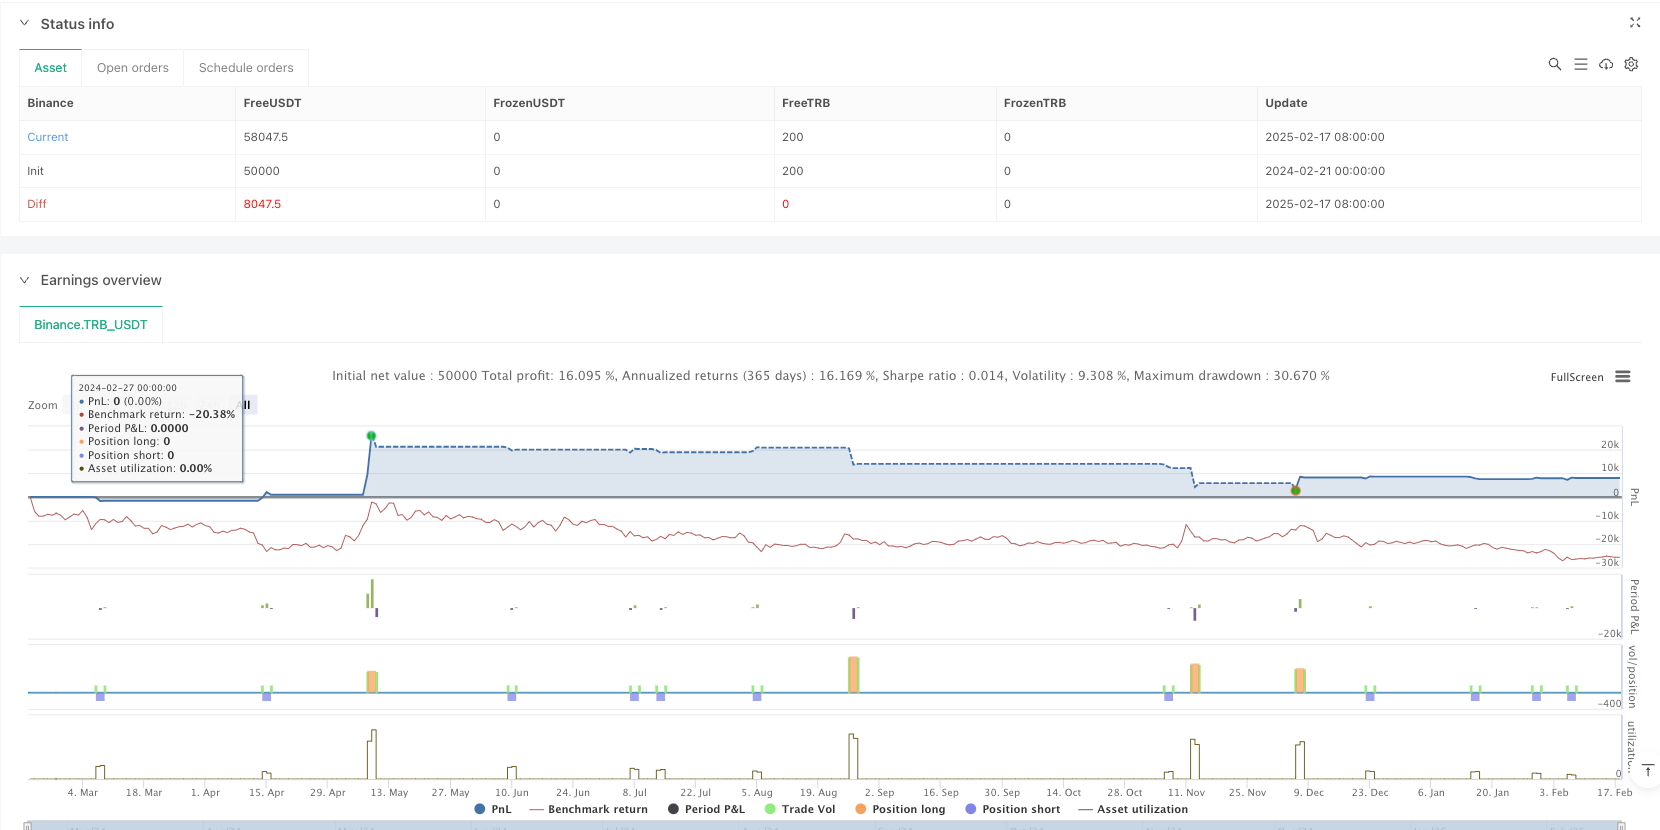

概述
该策略是一个基于价格突破和动态追踪止损的交易系统。它通过监控过去N个周期的最高价和最低价,在价格突破这些关键水平时进行交易。策略采用了智能的止损机制,只有在达到1%的盈利后才激活追踪止损,这样可以让盈利充分发展。同时通过设置1小时的冷却时间来避免过度交易,提高每笔交易的质量。
策略原理
策略的核心逻辑包括以下几个关键部分: 1. 入场信号:通过计算过去N个周期的最高价和最低价,当当前价格突破这些水平时触发交易信号。多头入场要求价格突破前期高点一定百分比,空头则需突破前期低点。 2. 交易管理:实施1小时交易冷却期,避免在波动剧烈时频繁交易。 3. 风险控制:采用动态追踪止损,只在获得1%盈利后激活,可以更好地保护利润。 4. 参数优化:关键参数如回看周期、突破阈值、止损百分比等都可以根据不同市场情况进行调整。
策略优势
- 动态风险管理:通过追踪止损机制,策略可以在保护盈利的同时让利润持续增长。
- 灵活适应性:策略可以适应不同的市场条件,通过调整参数来优化表现。
- 过滤机制:使用交易冷却期来避免过度交易,提高交易质量。
- 简单有效:策略逻辑清晰,容易理解和执行,同时保持了较好的可扩展性。
策略风险
- 假突破风险:市场可能出现假突破,导致错误信号。建议增加成交量确认。
- 滑点影响:在高波动期间,可能面临较大滑点,影响策略表现。
- 参数敏感性:策略表现对参数设置较为敏感,需要careful优化。
- 市场环境依赖:在低波动率环境下可能表现不佳。
策略优化方向
- 引入成交量指标:通过成交量确认来提高突破信号的可靠性。
- 增加趋势过滤:结合长期趋势指标,只在趋势方向交易。
- 动态参数调整:根据市场波动率自动调整突破阈值和止损参数。
- 多重时间周期:整合多个时间周期的信号来提高准确率。
总结
这是一个设计合理的趋势跟踪策略,通过价格突破和动态止损相结合,既能捕捉大趋势又能有效控制风险。策略的可定制性强,通过参数优化可以适应不同市场环境。建议在实盘中从小仓位开始,逐步验证策略在不同市场条件下的表现。
策略源码
/*backtest
start: 2024-02-21 00:00:00
end: 2025-02-18 08:00:00
period: 2d
basePeriod: 2d
exchanges: [{"eid":"Binance","currency":"TRB_USDT"}]
*/

//@version=5
//TSLA has the buest results on the 5 min or 1 hour chart
//NQ 15 minute
strategy("!! 🔥 Breakout Strategy with Trailing Stop", overlay=true,
         default_qty_type=strategy.percent_of_equity, default_qty_value=100,
         pyramiding=100)

// User inputs
var int lookbackBars = input.int(10, title="Lookback Bars", minval=1)
var float breakoutThresholdPct = input.float(0.05, title="Breakout Threshold Percentage", minval=0.0001, maxval=5, step=0.01)
var float stopLossPct = input.float(0.2, title="Stop Loss Percentage", minval=0.1) / 100
// Adjusted: No longer directly using takeProfitPct for a fixed take profit level
var float trailStartPct = input.float(0.5, title="Trail Start at Profit Percentage", minval=0.001) / 100

// Tracking the last entry time
var float lastEntryTime = na

// Calculate the highest high and lowest low over the last N bars excluding the current bar
float previousHigh = ta.highest(high[1], lookbackBars)
float previousLow = ta.lowest(low[1], lookbackBars)


// Entry condition adjusted to compare current price against the previous period's high/low
bool breakoutHigh = close > previousHigh * (1 + breakoutThresholdPct / 100) and (na(lastEntryTime) or (time - lastEntryTime) > 3600000 )
bool breakoutLow = close < previousLow * (1 - breakoutThresholdPct / 100) and (na(lastEntryTime) or (time - lastEntryTime) > 3600000 )

// Execute strategy based on the breakout condition
if (breakoutHigh)
    strategy.entry("Breakout Buy", strategy.long)
    lastEntryTime := time
else if (breakoutLow)
    strategy.entry("Breakout Sell", strategy.short)
    lastEntryTime := time

// Exiting the strategy with a trailing stop that starts after reaching 1% profit
// Adjusted: Implementing a dynamic trailing stop that activates after a 1% profit
if strategy.position_size > 0
    strategy.exit("Trailing Stop Exit", "Breakout Buy", trail_points = close * trailStartPct, trail_offset = close * stopLossPct)
if strategy.position_size < 0
    strategy.exit("Trailing Stop Exit", "Breakout Sell", trail_points = close * trailStartPct, trail_offset = close * stopLossPct)

// Visualization for debugging and analysis
plot(previousHigh, color=color.green, linewidth=2, title="Previous High")
plot(previousLow, color=color.red, linewidth=2, title="Previous Low")
// plotshape(series=breakoutHigh, location=location.belowbar, color=color.green, style=shape.labelup, text="BUY")
// plotshape(series=breakoutLow, location=location.abovebar, color=color.red, style=shape.labeldown, text="SELL")
相关推荐