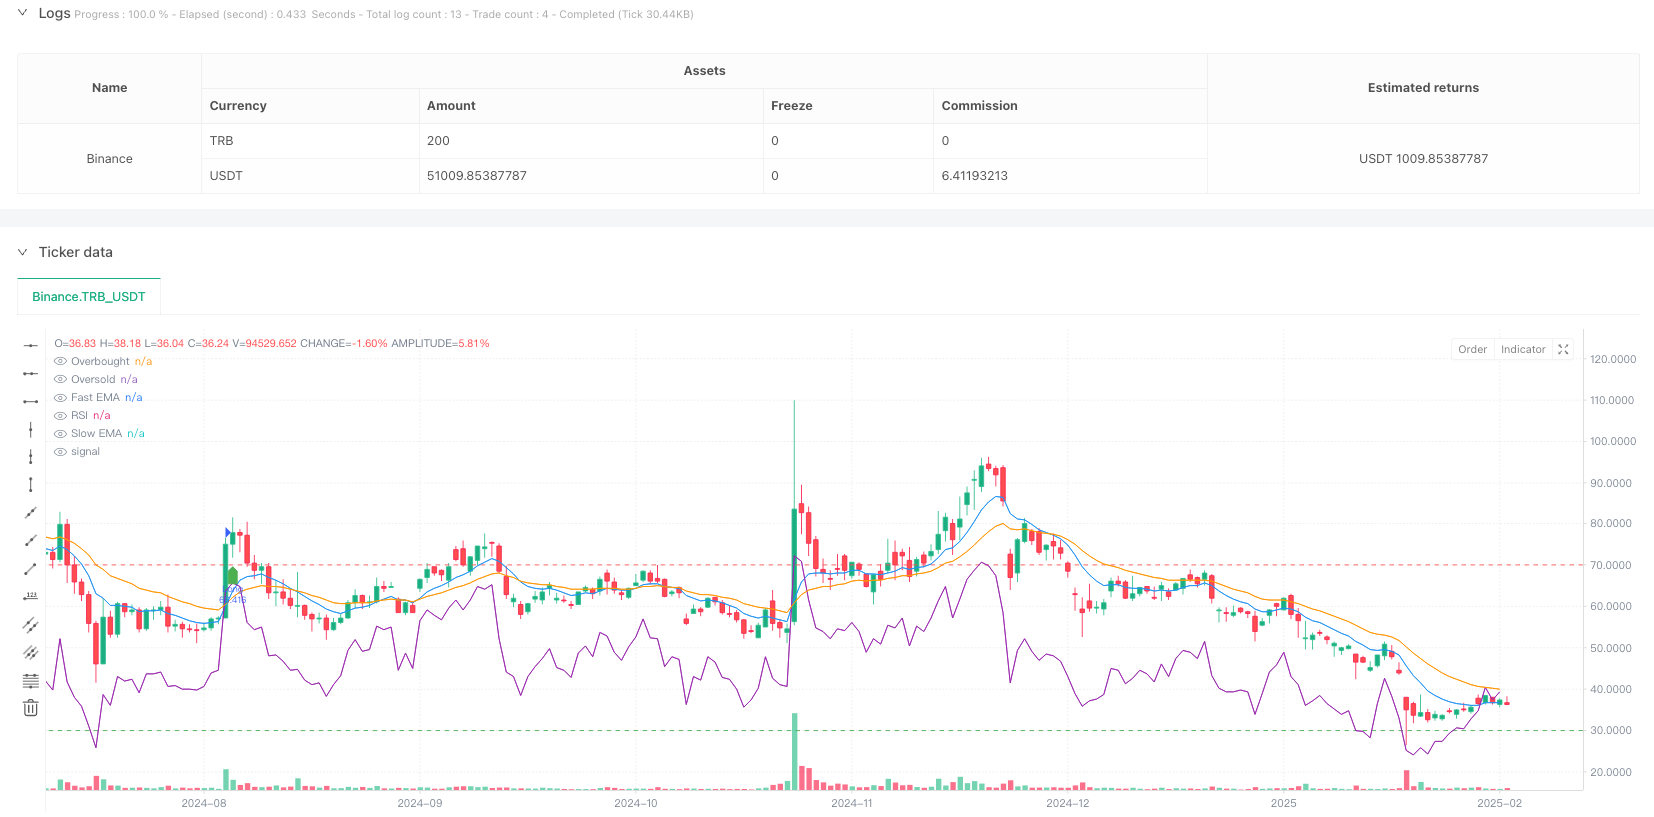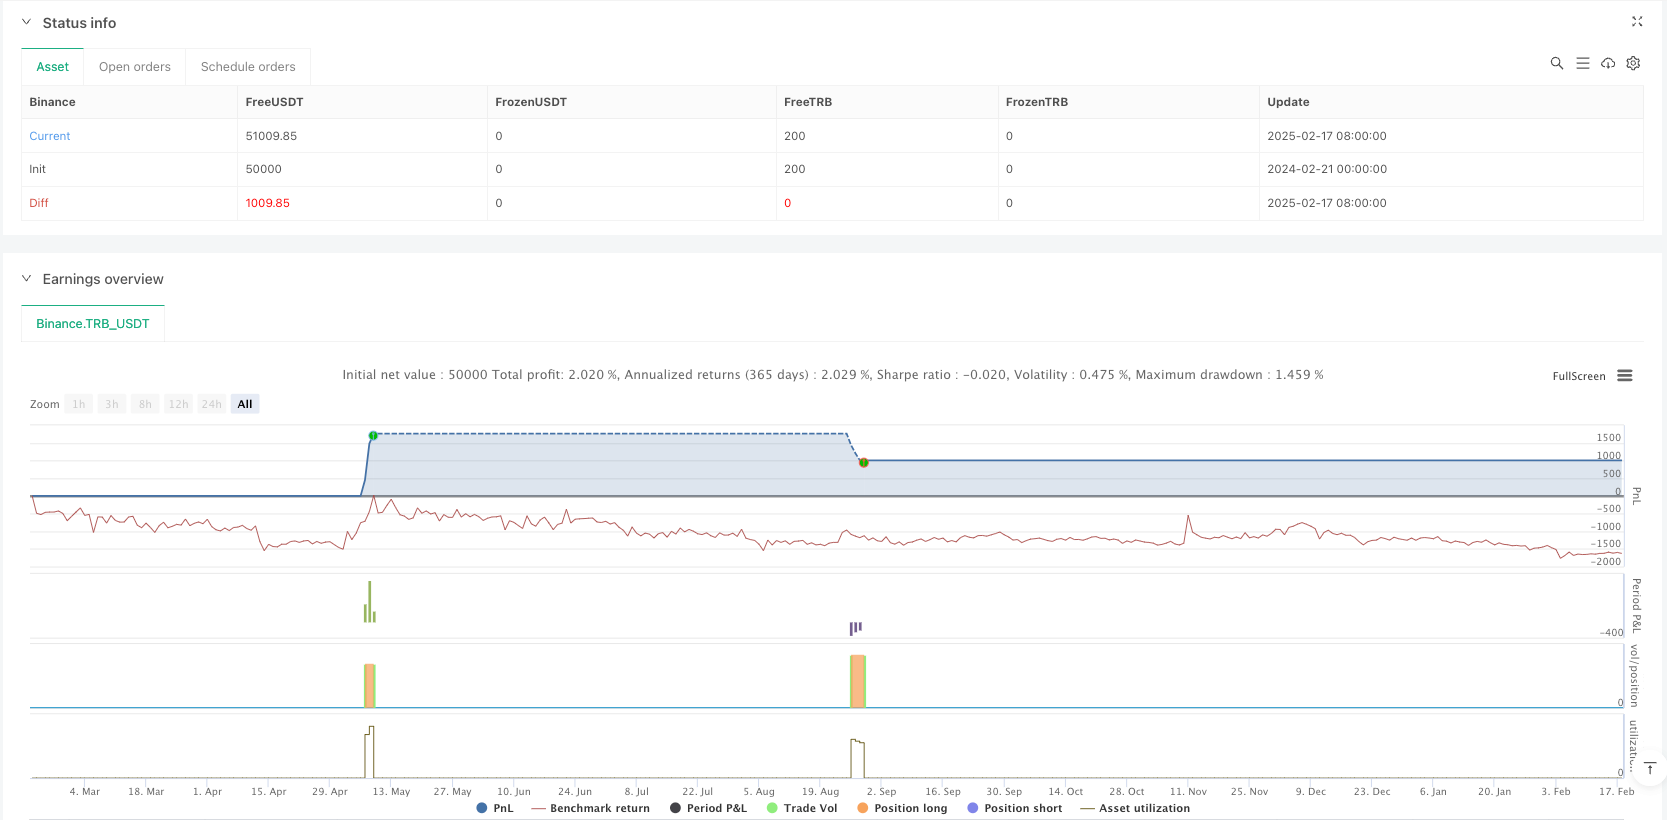

概述
该策略是一个基于多重技术指标的趋势跟踪交易系统。它结合了均线(EMA)、相对强弱指标(RSI)、成交量(Volume)和真实波幅指标(ATR)来确定入场时机,并使用ATR动态设置止损和止盈位置。策略还加入了K线突破确认机制,以提高交易信号的可靠性。
策略原理
策略使用快速EMA(9周期)和慢速EMA(21周期)的交叉来捕捉趋势变化。在此基础上,结合RSI指标(14周期)来过滤过度买卖区域,要求RSI数值在超买(70)和超卖(30)区域之外。同时,策略要求成交量大于20周期成交量均线,并且需要收盘价突破前一根K线的高低点作为额外确认。入场后使用基于ATR的动态止损(1.5倍ATR)和止盈(3倍ATR)设置,并采用跟踪止损(1倍ATR)机制保护利润。
策略优势
- 多重技术指标的综合应用提高了交易信号的可靠性
- 动态的止损止盈设置适应市场波动性变化
- 跟踪止损机制有效保护已获利润
- 成交量确认机制减少虚假突破
- K线突破确认增加了交易的准确性
- 策略参数可根据不同市场特性灵活调整
策略风险
- 多重指标可能导致错过部分交易机会
- 在横盘市场可能产生频繁假信号
- 快速剧烈波动可能导致止损位置不够理想
- 大幅跳空可能突破止损位置造成超预期损失 建议采取以下措施来管理风险:
- 定期优化指标参数以适应市场变化
- 结合更大时间周期走势进行交易过滤
- 设置每日最大交易次数限制
- 实施合理的资金管理计划
策略优化方向
引入自适应指标参数: 可以根据市场波动率自动调整EMA和RSI的周期设置,使策略更好地适应不同市场环境。
增加市场环境过滤: 添加趋势强度指标如ADX,在横盘市场自动降低仓位或暂停交易。
优化止损方案: 可以考虑结合支撑阻力位置设置止损,提高止损的有效性。
完善交易量管理: 根据市场波动性和流动性动态调整持仓规模。
总结
这是一个结构完整、逻辑严密的趋势跟踪策略。通过多重技术指标的配合使用,既保证了交易信号的可靠性,又能有效控制风险。动态的止损止盈设置则提供了良好的风险收益比。策略的可优化空间较大,通过持续改进可以适应更多的市场环境。
策略源码
/*backtest
start: 2024-02-21 00:00:00
end: 2025-02-18 08:00:00
period: 1d
basePeriod: 1d
exchanges: [{"eid":"Binance","currency":"TRB_USDT"}]
*/

//@version=6
strategy("15m EMA RSI Strategy with ATR SL/TP and Candle Break Confirmation", overlay=true, initial_capital=100000, default_qty_type=strategy.percent_of_equity, default_qty_value=10)

// INPUTS
fastLength         = input.int(9, title="Fast EMA Length")
slowLength         = input.int(21, title="Slow EMA Length")
rsiLength          = input.int(14, title="RSI Length")
rsiOverbought      = input.int(70, title="RSI Overbought Level")
rsiOversold        = input.int(30, title="RSI Oversold Level")
volLength          = input.int(20, title="Volume MA Length")
atrLength          = input.int(14, title="ATR Length")
atrMultiplierSL    = input.float(1.5, title="ATR Multiplier for Stop Loss")
atrMultiplierTP    = input.float(3.0, title="ATR Multiplier for Take Profit")
trailingStopMultiplier = input.float(1.0, title="ATR Multiplier for Trailing Stop")

// INDICATOR CALCULATIONS
fastEMA  = ta.ema(close, fastLength)
slowEMA  = ta.ema(close, slowLength)
rsiValue = ta.rsi(close, rsiLength)
volMA    = ta.sma(volume, volLength)
atr      = ta.atr(atrLength)

// Candle Breakout Conditions for Confirmation
longCandleBreak  = close > high[1]
shortCandleBreak = close < low[1]

// Plot EMAs for visual reference
plot(fastEMA, color=color.blue, title="Fast EMA")
plot(slowEMA, color=color.orange, title="Slow EMA")

// ENTRY CONDITIONS
longCondition = ta.crossover(fastEMA, slowEMA) and (rsiValue < rsiOverbought) and (volume > volMA) and longCandleBreak
shortCondition = ta.crossunder(fastEMA, slowEMA) and (rsiValue > rsiOversold) and (volume > volMA) and shortCandleBreak

// Plot Buy/Sell Signals on the Chart
plotshape(longCondition, title="Buy Signal", location=location.belowbar, color=color.green, style=shape.labelup, size=size.normal)
plotshape(shortCondition, title="Sell Signal", location=location.abovebar, color=color.red, style=shape.labeldown, size=size.normal)

// TRADE EXECUTION WITH ATR-BASED STOP LOSS, TAKE PROFIT, AND TRAILING STOP
if longCondition
    longStop = close - atrMultiplierSL * atr
    longTP   = close + atrMultiplierTP * atr
    strategy.entry("Long", strategy.long)
    strategy.exit("Exit Long", from_entry="Long", stop=longStop, limit=longTP, trail_points=atr * trailingStopMultiplier)

if shortCondition
    shortStop = close + atrMultiplierSL * atr
    shortTP   = close - atrMultiplierTP * atr
    strategy.entry("Short", strategy.short)
    strategy.exit("Exit Short", from_entry="Short", stop=shortStop, limit=shortTP, trail_points=atr * trailingStopMultiplier)

// OPTIONAL: Plot RSI for reference
hline(rsiOverbought, "Overbought", color=color.red)
hline(rsiOversold, "Oversold", color=color.green)
plot(rsiValue, color=color.purple, title="RSI")
相关推荐