Multi-Level RSI Cross-Under Regression Pyramiding Strategy

Overview
This strategy is an automated trading system based on the Relative Strength Index (RSI), primarily designed to capture potential rebounds by identifying oversold market conditions. The strategy employs a progressive position-building approach, gradually establishing multiple positions when RSI crosses at low levels, with risk control through profit targets. The system features a flexible capital management mechanism, using 6.6% of total account equity per trade, allowing up to 15 pyramiding entries.
Strategy Principles
The core logic of the strategy is based on the following key elements:
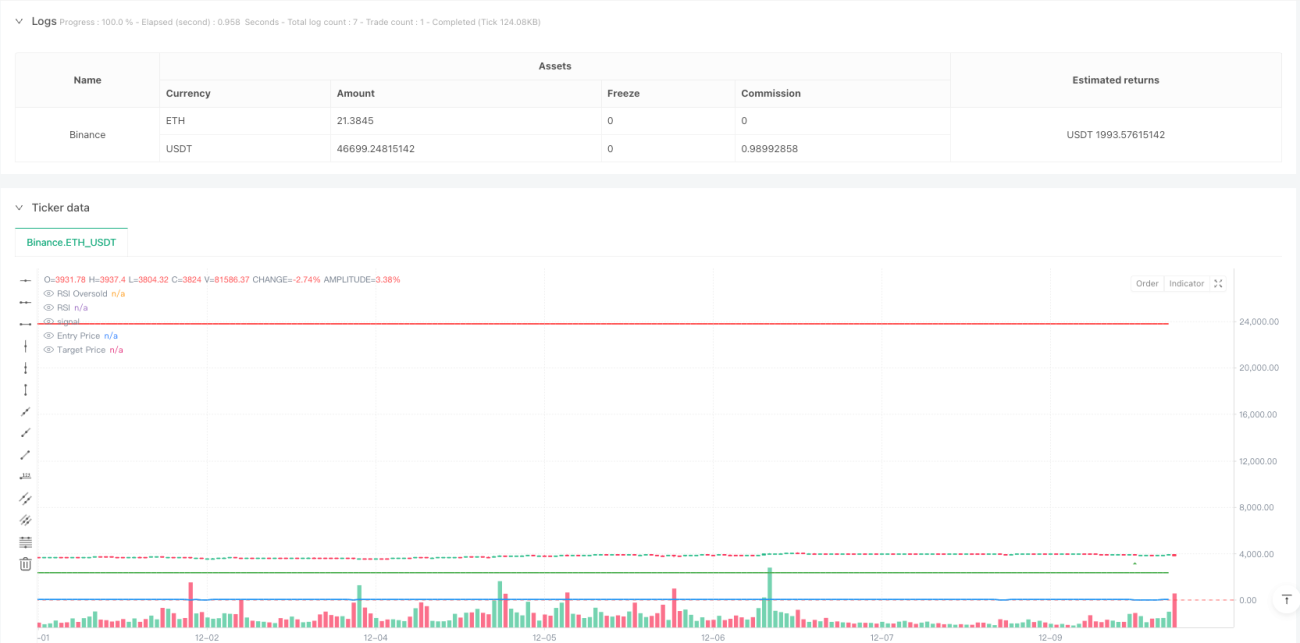
- Entry Signal: Buy signals are triggered when 14-period RSI crosses below the oversold level of 28.5
- Position Management: Single position size is 6.6% of account equity, allowing up to 15 progressive entries
- Profit Taking: Closes 50% of the position when price reaches 900% gain from entry price
- Visualization: Displays buy/sell signals, RSI curve, entry price, and target price on charts
The strategy observes RSI behavior in oversold territory to determine market trends, gradually building positions upon oversold signals to reduce average entry costs.
Strategy Advantages
- Systematic Entry: Automatically identifies trading opportunities through preset RSI parameters, avoiding subjective bias
- Risk Diversification: Uses progressive position building at different price levels, effectively spreading risk
- Flexibility: Strategy parameters can be adjusted according to different market environments and risk preferences
- Profit Protection: Sets clear profit targets with automatic position reduction to lock in partial gains
- Capital Efficiency: Optimizes capital utilization through proper position control and pyramiding mechanism
Strategy Risks
- Trend Risk: Frequent entry signals may trigger during strong downtrends, leading to losses
- Parameter Sensitivity: Improper settings of RSI parameters and position sizing can affect strategy performance
- Market Liquidity: Difficulty executing trades at target prices in illiquid markets
- Capital Management: Excessive pyramiding may lead to overexposure
Solutions:
- Add trend filters to pause entries during clear downtrends
- Optimize parameters through backtesting
- Set maximum drawdown limits
- Dynamically adjust pyramiding thresholds
Strategy Optimization
- Dynamic Parameters: Automatically adjust RSI parameters and entry conditions based on market volatility
- Stop-Loss Mechanism: Add trailing stop-loss functionality for better risk control
- Market Filters: Incorporate volume and trend filters to improve signal quality
- Exit Optimization: Design more flexible profit-taking mechanisms, such as staged position reduction
- Risk Control: Add maximum drawdown limits and exposure control
Summary
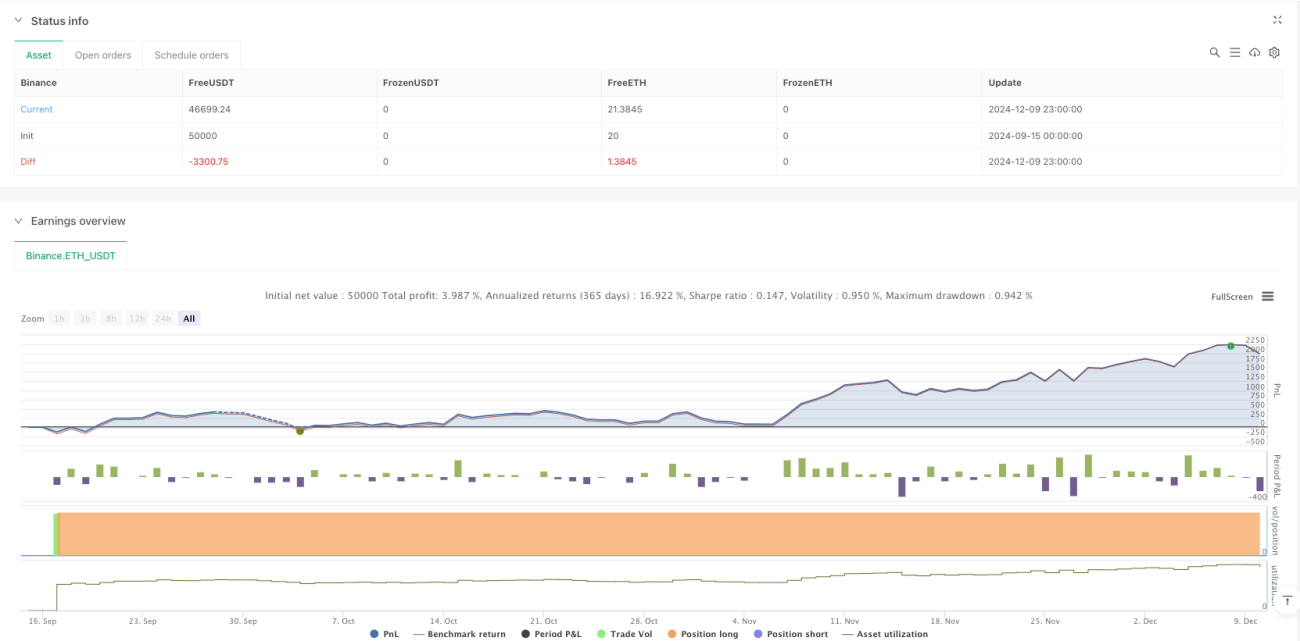
The strategy identifies oversold opportunities through RSI indicator, combining pyramiding entries with fixed-ratio profit-taking to create a complete trading system. Its strengths lie in systematic operation and risk diversification, but attention must be paid to market trends and parameter settings affecting strategy performance. The strategy's stability and profitability can be further enhanced through dynamic parameter adjustment, stop-loss mechanisms, and market filters.
/*backtest
start: 2024-09-15 00:00:00
end: 2024-12-10 00:00:00
period: 1h
basePeriod: 1h
exchanges: [{"eid":"Binance","currency":"ETH_USDT"}]
*/

//@version=5
strategy("RSI Cross Under Strategy", overlay=true, initial_capital=1500, default_qty_type=strategy.percent_of_equity, default_qty_value=6.6)

// Input parameters- 1