Momentum Divergence Trend Reversal Quantitative Strategy Based on MACD Histogram

Overview
This strategy is a trend reversal trading system based on MACD histogram momentum divergence. It captures market reversal signals by analyzing the relationship between candlestick pattern changes and MACD histogram momentum changes. The core idea is to take counter-trend positions when signs of momentum decay appear, thereby positioning ahead of potential trend reversals.
Strategy Principle
The trading logic is divided into short and long directions:
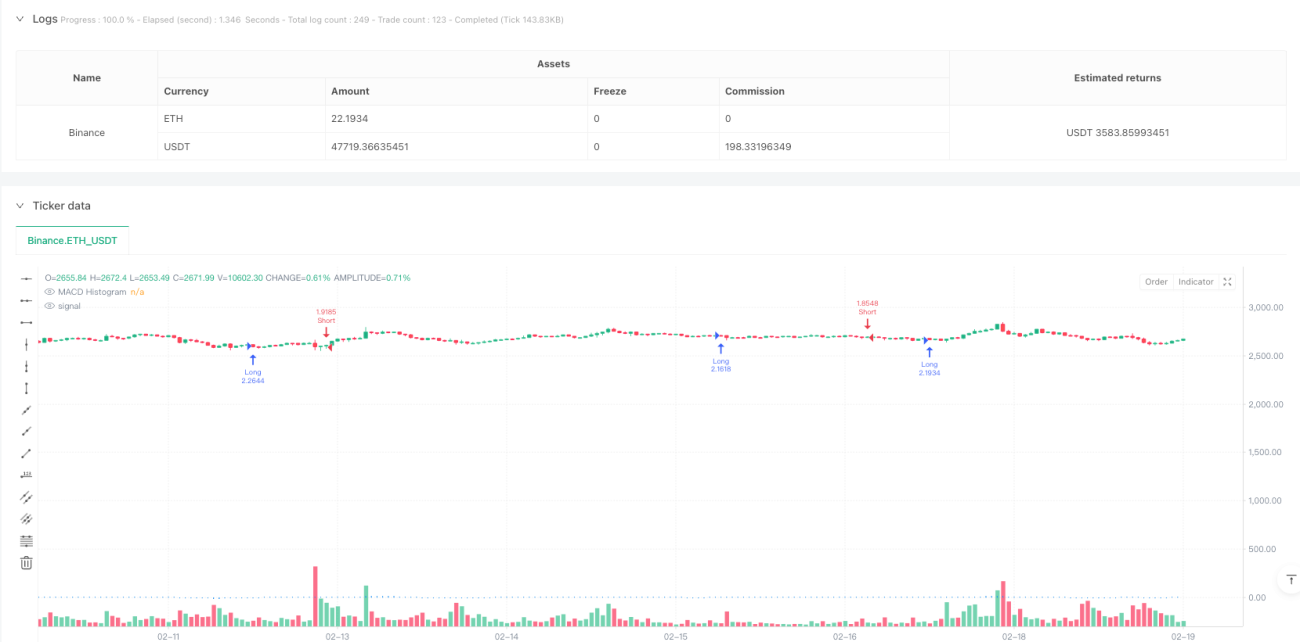
Short Entry: When a large bullish candle appears (close above open) with a body larger than the previous candle, and the MACD histogram shows a declining trend for three consecutive periods, indicating weakening upward momentum, the system generates a short signal.
Long Entry: When a large bearish candle appears (close below open) with a body larger than the previous candle, and the MACD histogram shows an ascending trend for three consecutive periods, indicating weakening downward momentum, the system generates a long signal.
Position management uses counter-signal exit mechanism, closing positions when opposite trading signals appear. The strategy doesn't set stop-loss or take-profit levels, relying entirely on signals for position management.
Strategy Advantages
- Clear Signals: The strategy considers both candlestick patterns and technical indicators, providing more reliable trading signals.
- Reversal Detection: By monitoring momentum changes, it can identify market turning points early.
- Controlled Risk: Using counter-signal exits prevents holding unfavorable positions during trend changes.
- Simple Operation: Trading rules are clear, easy to execute and backtest.
- High Adaptability: The strategy can be applied to different markets and timeframes.
Strategy Risks
- False Breakout Risk: Markets may exhibit false breakouts, leading to incorrect signals.
- Choppy Market Risk: Frequent trend changes in range-bound markets may result in consecutive losses.
- Slippage Risk: Large trades may face significant slippage in low liquidity conditions.
- Overtrading Risk: Frequent signals may generate high transaction costs.
- Market Environment Dependency: Strategy performs better in trending markets but may underperform in other conditions.
Strategy Optimization Directions
- Implement Trend Filters: Add trend identification indicators, such as moving average systems, to filter false signals in choppy markets.
- Optimize Stop-Loss Mechanism: Set reasonable stop-loss levels to control per-trade risk.
- Improve Take-Profit Mechanism: Dynamically adjust profit-taking levels based on market volatility.
- Add Trading Filters: Such as volume confirmation and volatility filters to improve signal quality.
- Enhance Position Management: Introduce dynamic position sizing mechanisms to adjust exposure based on market conditions.
Summary
This strategy captures market reversal opportunities by combining candlestick patterns and MACD histogram momentum changes, featuring simple operation and clear signals. While certain risks exist, the strategy's stability and profitability can be significantly enhanced through appropriate optimization and risk management measures. It is particularly suitable for trending market environments and can serve as an important component of a trading system.
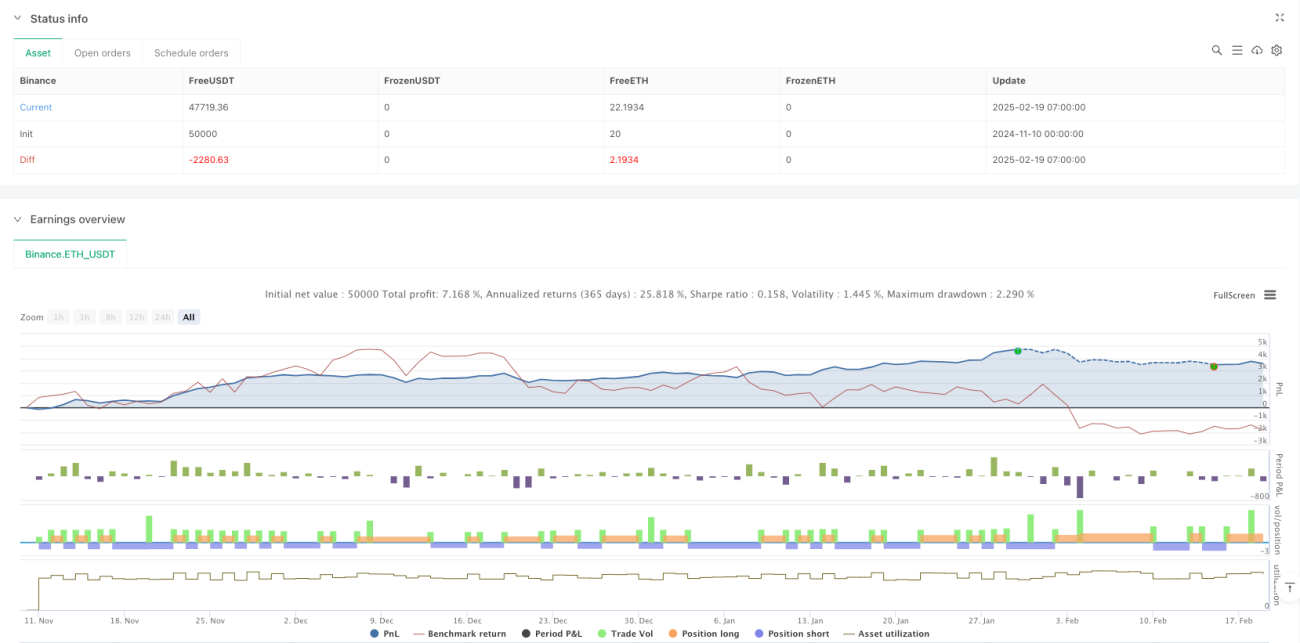
/*backtest
start: 2024-11-10 00:00:00
end: 2025-02-19 08:00:00
period: 1h
basePeriod: 1h
exchanges: [{"eid":"Binance","currency":"ETH_USDT"}]
*/

//@version=5
strategy("MACD Momentum Reversal Strategy", overlay=true, initial_capital=100000, default_qty_type=strategy.percent_of_equity, default_qty_value=10)

// === MACD Calculation ===- 1