
Overview
This is an intelligent trading system based on dual moving average crossover signals with integrated risk management features. The system utilizes short-term and long-term Simple Moving Averages (SMA) to generate trading signals while incorporating stop-loss and take-profit mechanisms for risk control. The strategy employs a percentage-based risk management approach, dynamically adjusting position sizes based on account equity, achieving automated and intelligent trading execution.
Strategy Principles
The strategy is based on the following core principles:
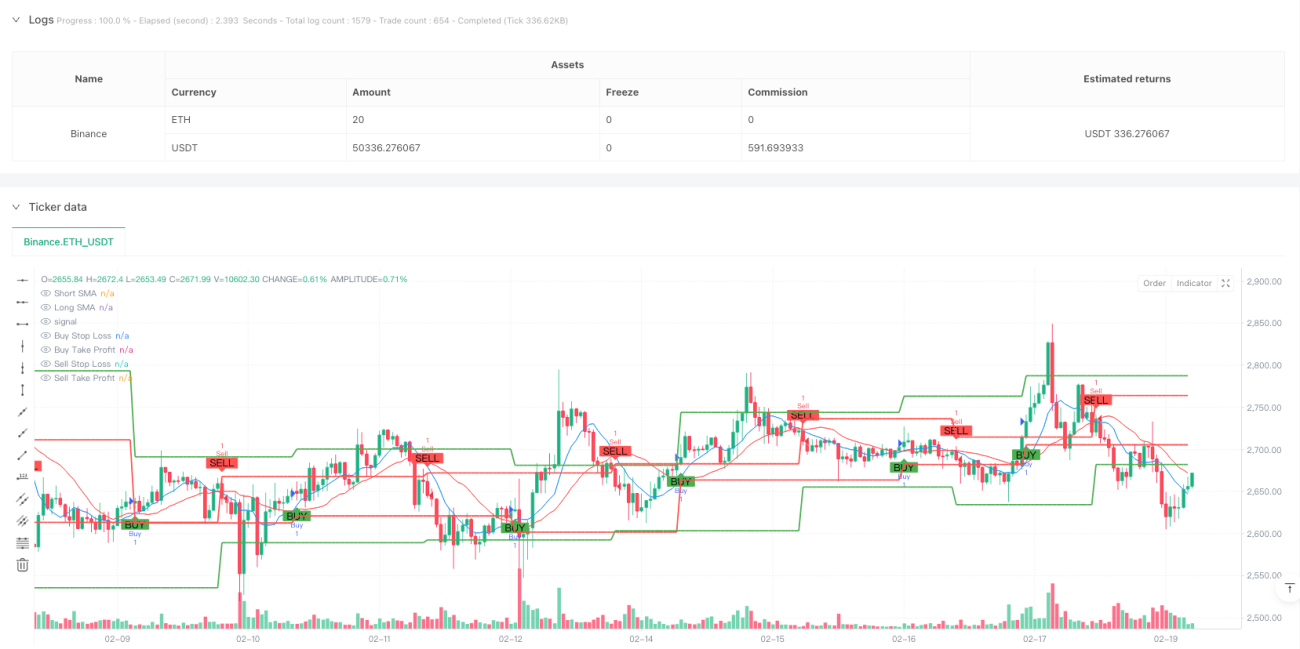
- Uses crossovers of 9-day and 21-day Simple Moving Averages (SMA) to capture market trends. A buy signal is generated when the short-term MA crosses above the long-term MA, and a sell signal when it crosses below.
- Implements a dynamic risk management system based on account equity. Risk per trade is fixed at 1% of account equity, with stop-loss set at 1% from entry price and take-profit at twice the stop-loss distance.
- Automatically calculates trade size to ensure risk amount remains constant at the predetermined level for each trade.
Strategy Advantages
- Simple and reliable signal system: Uses classic dual MA crossover system, easy to understand and maintain.
- Comprehensive risk control: Integrates stop-loss and take-profit functions, limiting maximum loss per trade.
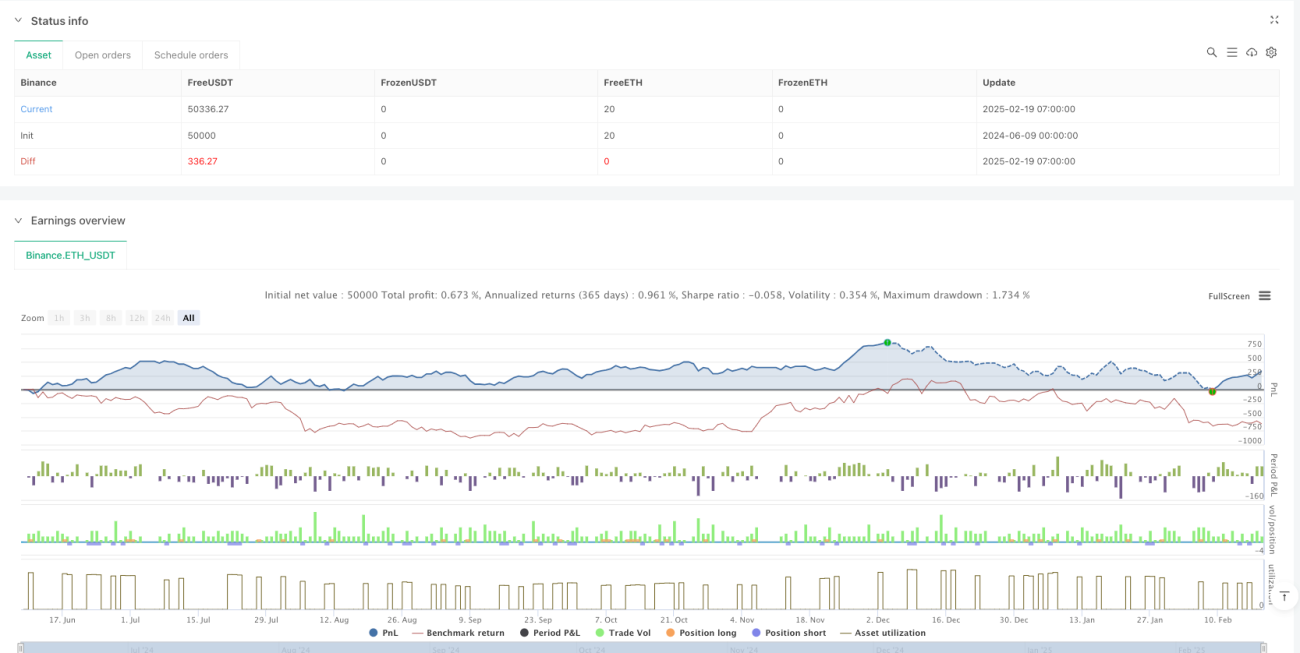
- Dynamic position management: Automatically adjusts trade size based on account equity, avoiding risks associated with fixed lot size trading.
- Strong visualization: Clearly displays trading signals, stop-loss and take-profit levels on the chart for easy monitoring and analysis.
- High parameter adaptability: Major parameters can be adjusted through the input interface to adapt to different market conditions.
Strategy Risks
- Choppy market risk: False breakout signals may occur frequently in sideways markets, leading to consecutive losses.
- Slippage risk: Actual execution prices may significantly deviate from theoretical prices during high volatility periods.
- Systemic risk: Stop-losses may fail during market gaps or major events.
- Parameter optimization risk: Over-optimization may lead to poor performance in live trading.
Strategy Optimization Directions
- Add trend filter: Incorporate trend indicators like ADX to execute trades only in strong trend conditions.
- Optimize stop-loss method: Consider implementing volatility-adaptive dynamic stop-loss for more flexible risk management.
- Introduce volume indicators: Integrate volume analysis to improve signal reliability.
- Add time filters: Avoid trading during high-volatility opening and closing periods.
- Implement drawdown control: Set maximum drawdown limits to automatically stop trading when losses reach specific levels.
Summary
This is an intelligent trading system that combines classic technical analysis methods with modern risk management concepts. It captures trends through dual MA crossovers while controlling risk through dynamic risk management, achieving automated execution. While there are areas for optimization, the overall design concept is advanced and has practical value. Traders are advised to thoroughly test and optimize the system according to specific market characteristics before live implementation.
- 1